hēg denu

yet another site by Hayden Stainsby

performance optimization with flamegraph and divan

on Monday, 29 April 2024

Not long ago, I came across a genuine case of code that needed optimising. I was really excited, as it's not every day that you can say this from the outset, and in this particular case, I was pretty sure that there was plenty of room for improvement, but I didn't know where.

Toot by me. Text: I have an honest to gods #algorithm in need of optimisation. It represents a very large percentage of CPU time per request on over 50% of requests to this one service. I have real input data to use for testing. I’m going to need to #profile, #benchmark, and run #performance tests across potential optimisations. I am so excited! #devLife #optimization.

how did I know?

One of our backend services was having trouble with the latency of the requests, up to such a point that it was causing instability. Basically, requests were so slow they caused the pods to timeout and get killed. We'd tracked this down to a specific type of request that required an expensive filtering operation. We knew it was expensive, but until this type of request had increased to over 50% of the requests in a specific region, it hadn't been an issue. Now it was.

As a quick experiment, we tried removing this filtering, and it made a very large difference.

Before going any further, let's make it easier to follow what I'm talking about and actually describe this mysterious filtering.

aside: corridor filter

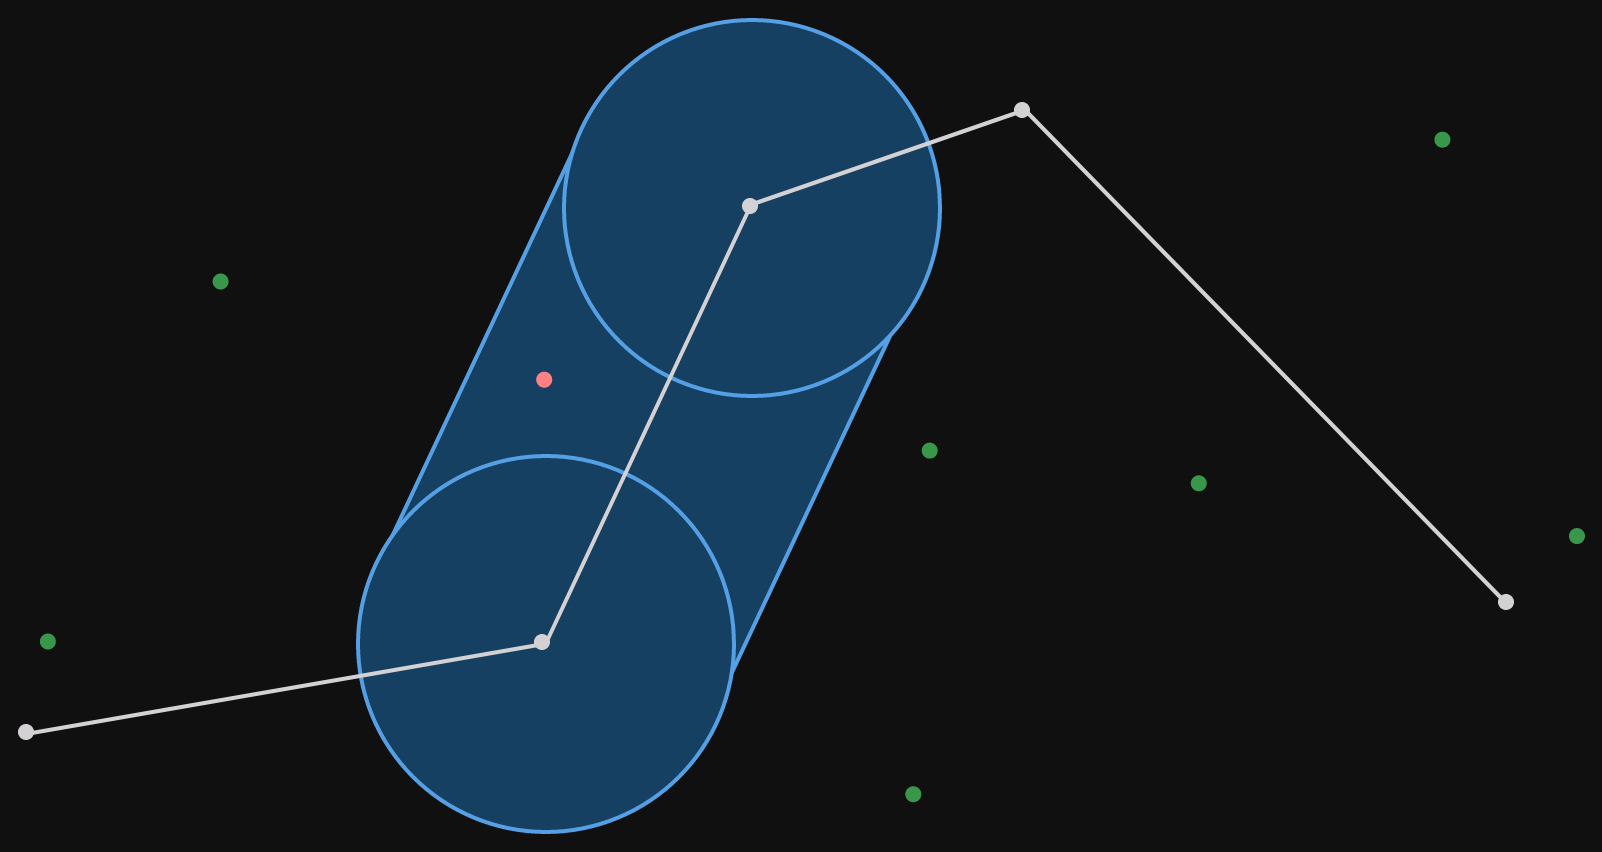
To set the scene, our context is filtering geographical points (points on a map). A corridor filter is a polyline with a radius. What does that mean?

A polyline is literally multiple lines, stuck together. In our case, we'll set the requirement that each point connects to two others (although overlapping and closing the polyline are allowed). Here's an example.

Five dots connected in a series by four line segments to form a polyline.

The radius means that we consider all the space that is r meters (because we're sensible and we use the metric system) from any part of the polyline. Visually, this can be shown as circles of radius r around each point and rotated rectangles centered on each line segment. This visualization can be seen in the image below. The corridor is all the area covered by the blue shapes.

Same polyline as the previous image, the radius is shown visually as circles and rectangles in blue around the polyline.

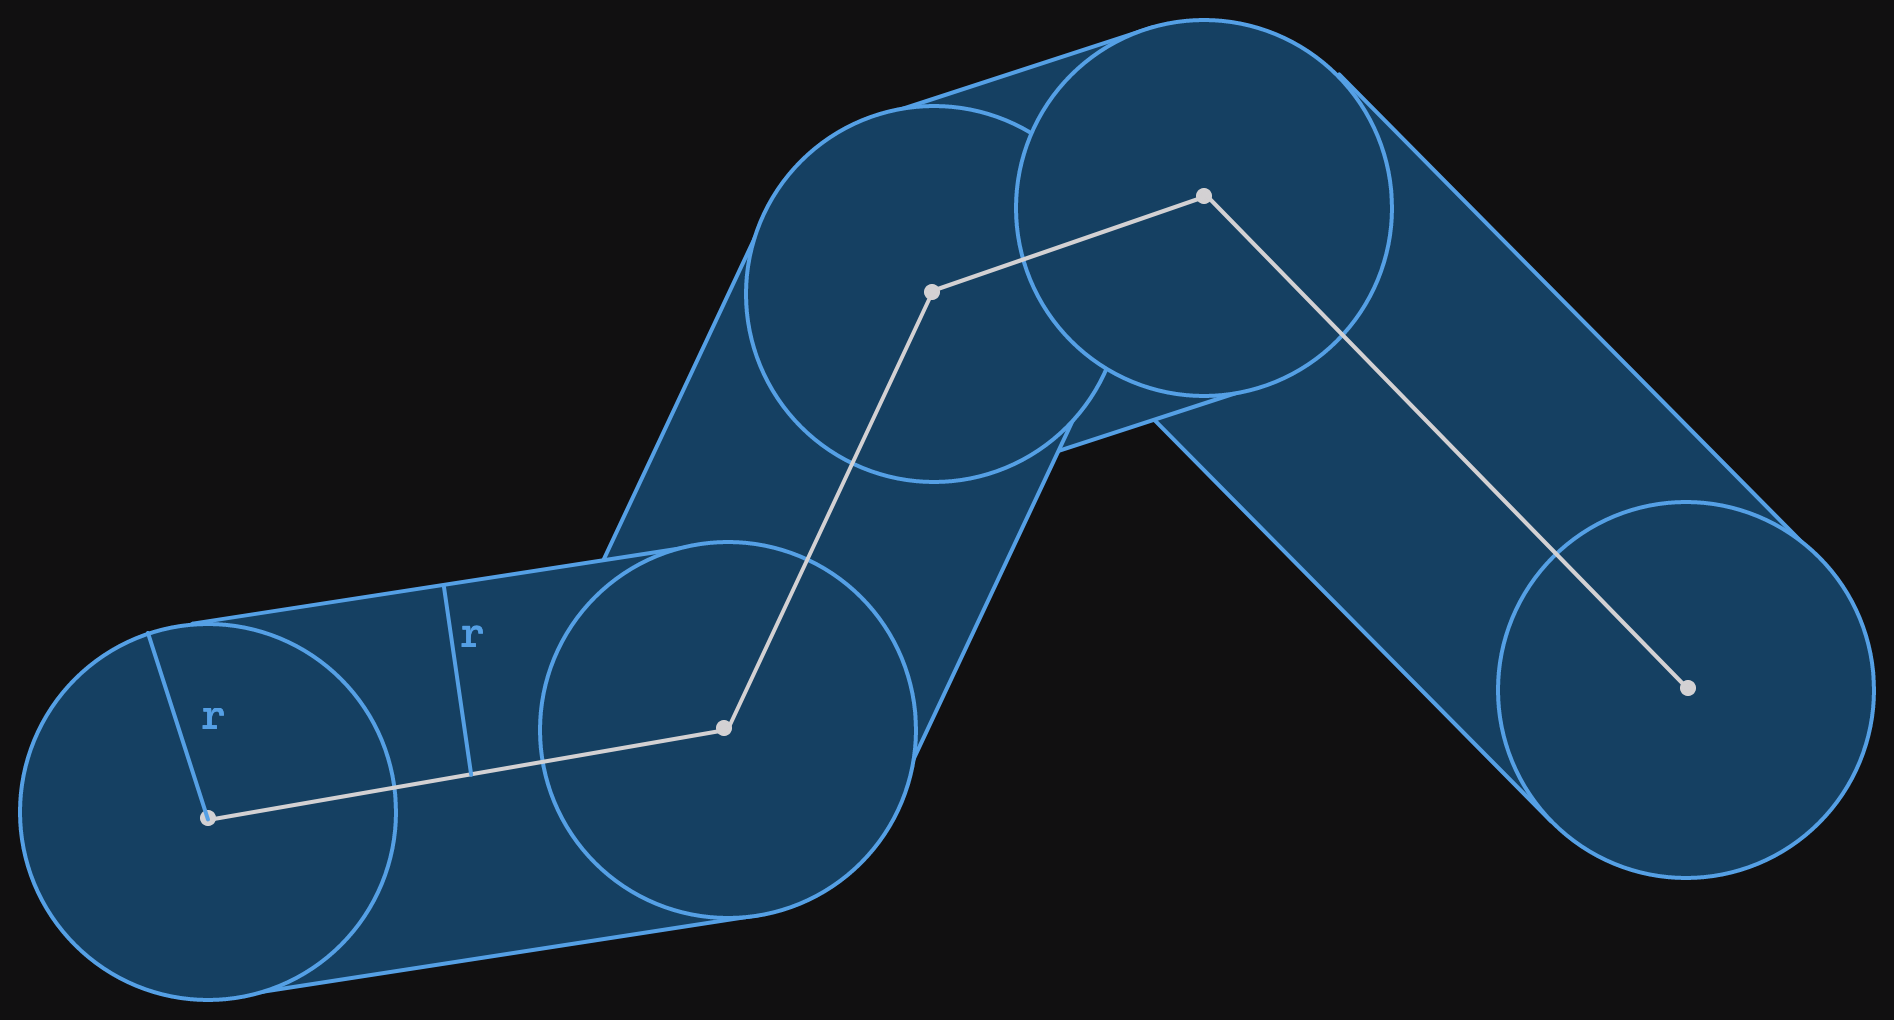
The radius r has been marked on the left most circle and rectangle.

That's our corridor. The corridor filter is a function that takes a corridor (polyline and a radius) and a set of points and returns only the points that are inside the corridor. Let's add some points in the same space as the corridor.

The polyline with radius shown with various points plotted around it. The points which fall inside the corridor are red, the points that fall outside are green.

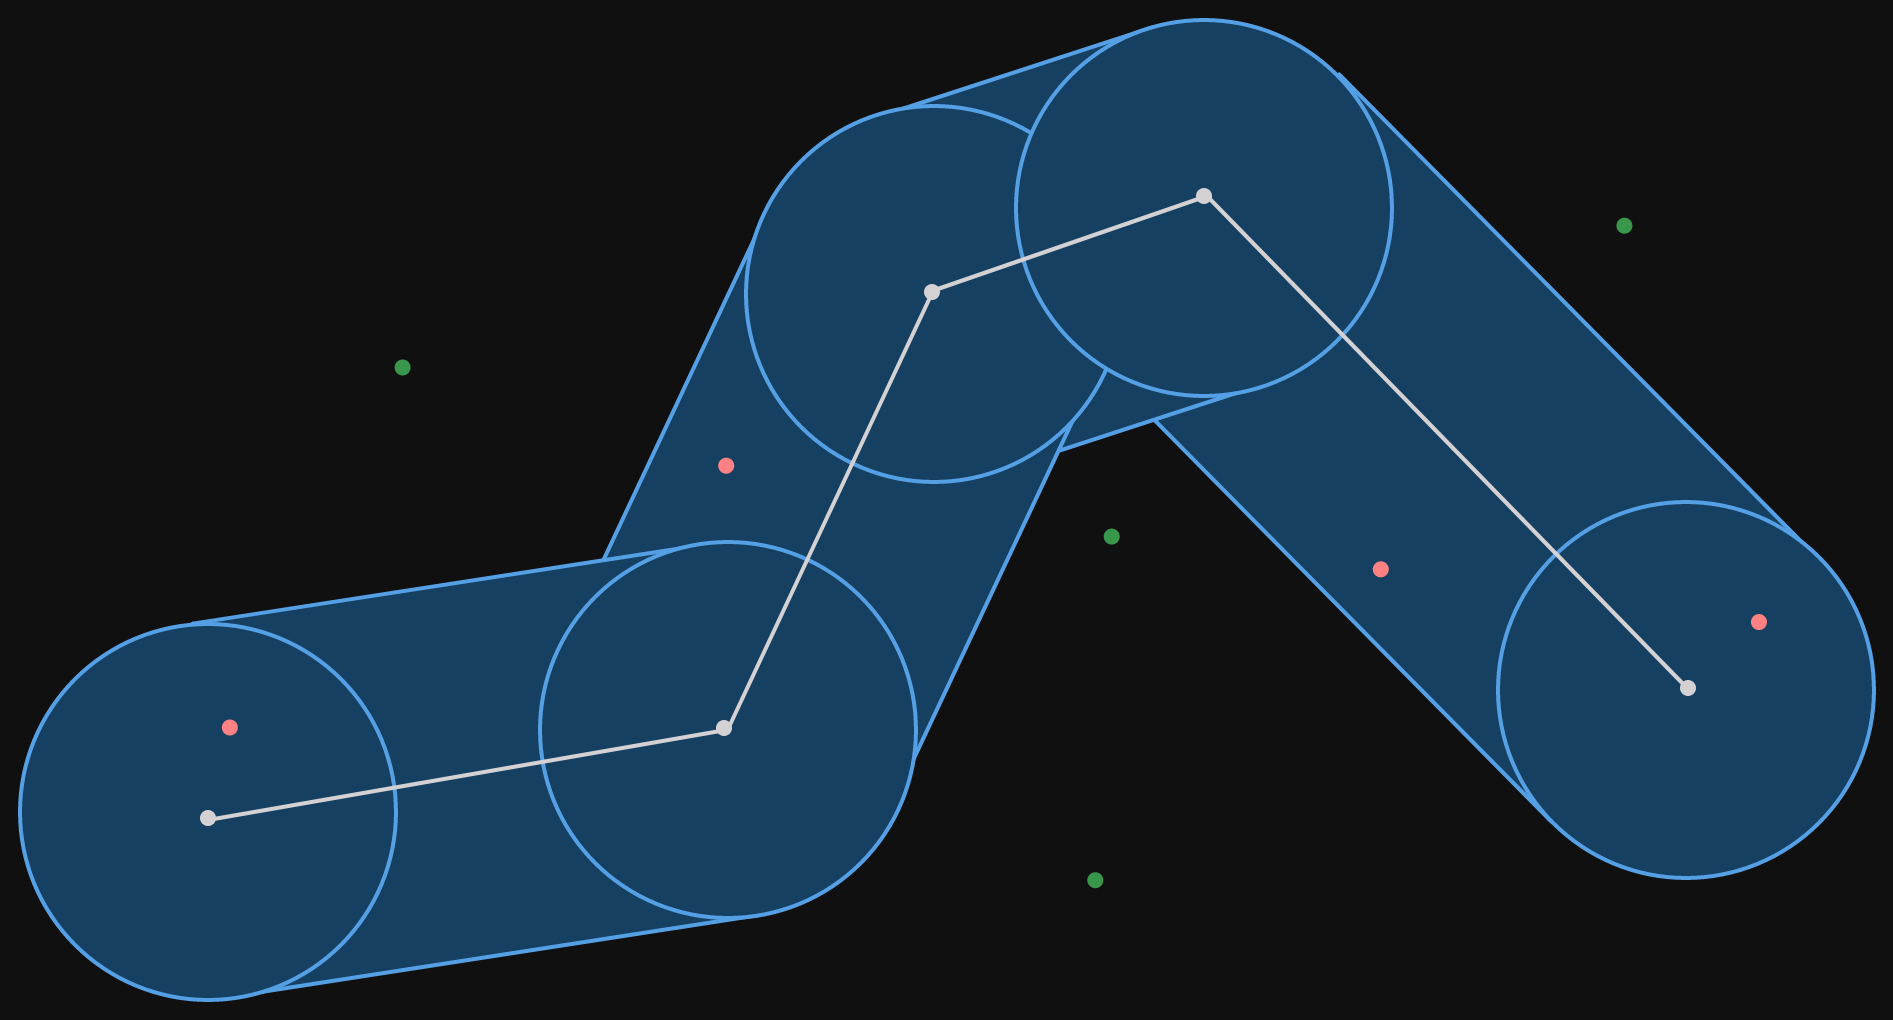
The points which fall inside the corridor are colored red, those that fall outside the corridor are colored green. The filter for this corridor would return only the red points.

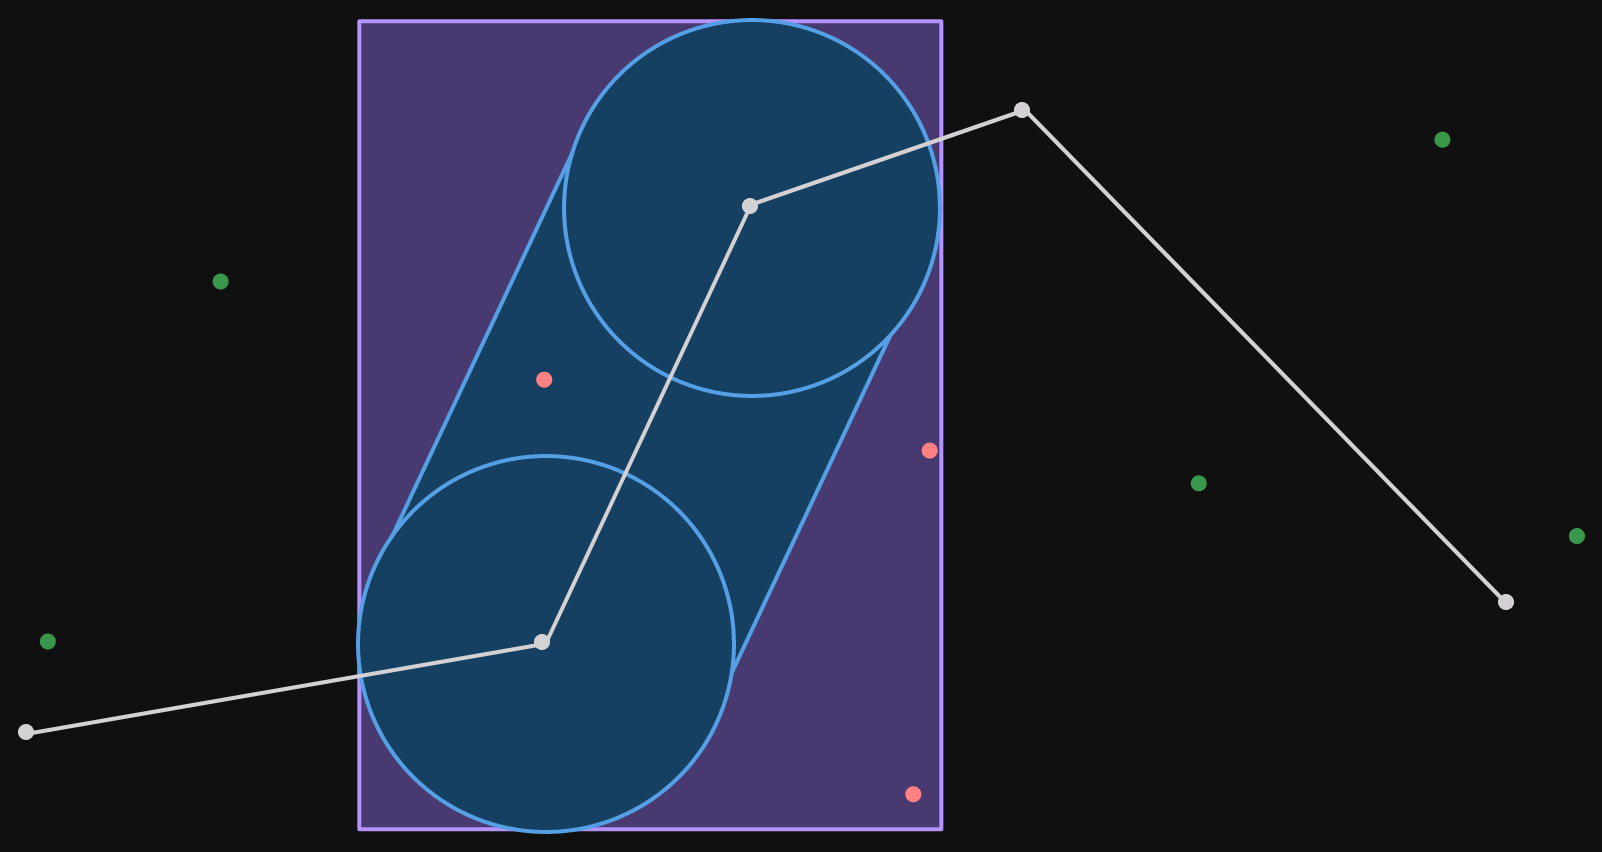
It is not only for illustration that the points are all close to the corridor. In the service, we select the points to filter for out of an index. The points that we preselect are those in a bounding box around the corridor itself. A bounding box is a straight (not rotated) rectangle drawn around some group of objects, in our case the corridor.

The corridor is shown (without the filtered points) with a purple rectangle drawn around it such that the edges of the rectangle and the corridor touch.

Notice how the bounding box can't be any smaller and still contain the corridor within it.

Now that we understand what a corridor filter is, let's go back to the experiment.

removing the filtering

As you can see from the image of the corridor with points inside and outside it, the corridor filter is a refinement step. We start with a set of points which are close to the corridor (within the bounding box) and then check which ones are inside the corridor.

As an experiment, we switched out a corridor request coming to the API for the bounding box around the corridor. This would mean that we have to serialize additional data, but the corridor filtering wouldn't be needed. We used this test to validate our assumption that the corridor test was the most expensive part of handling requests.

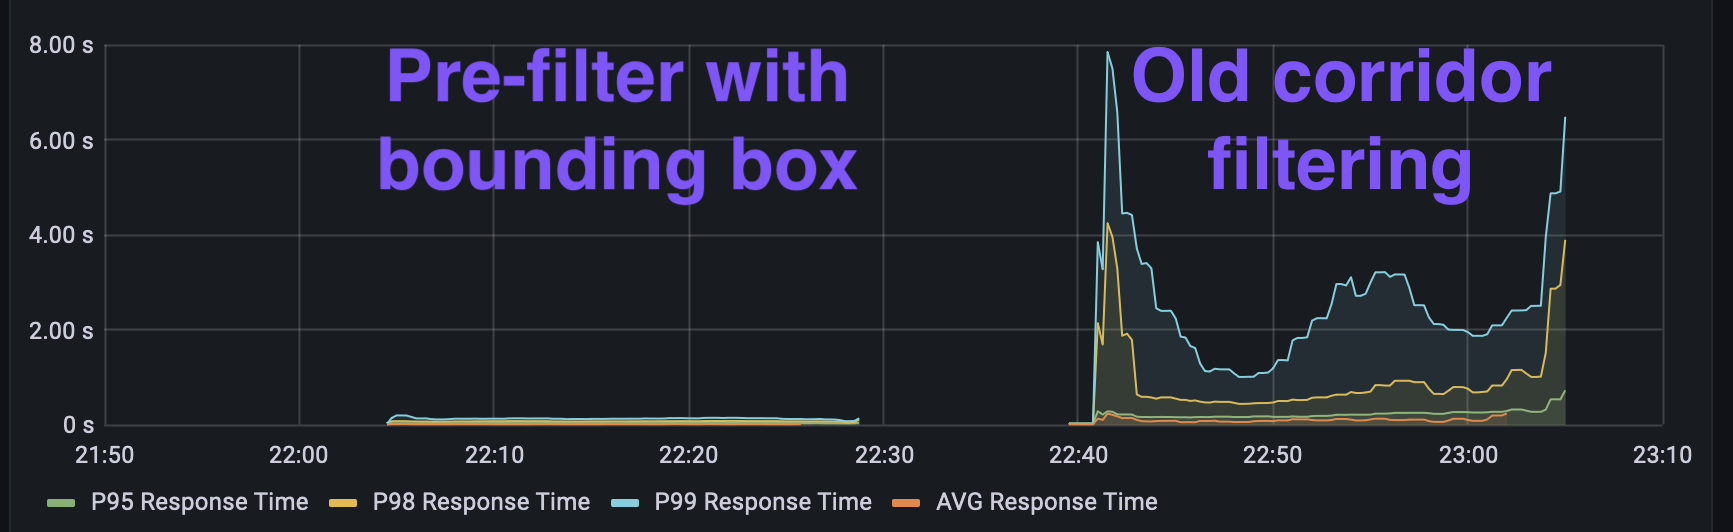
Using a set of requests previously seen in our worst performing region, a performance test was run, scaling up the number of requests. An initial test was run with the corridor filtering active, and then the second test was run with just the bounding boxes - all using the same request pool.

The results are quite clear when visualizing the response times (average, p95, p98, and p99). p99 response time means the 99th percentile of response times for some window - if you order all requests by response time and remove the slowest 1% of requests, the p99 response time is the slowest time that is left.

A time series graph showing average, p95, p98, and p99 response times. There are two separate sets of lines (executed at different times, with a gap in the middle), the ones on the left are labelled "Corridor filtering" adn the ones on the right are labelled "Only bounding box".

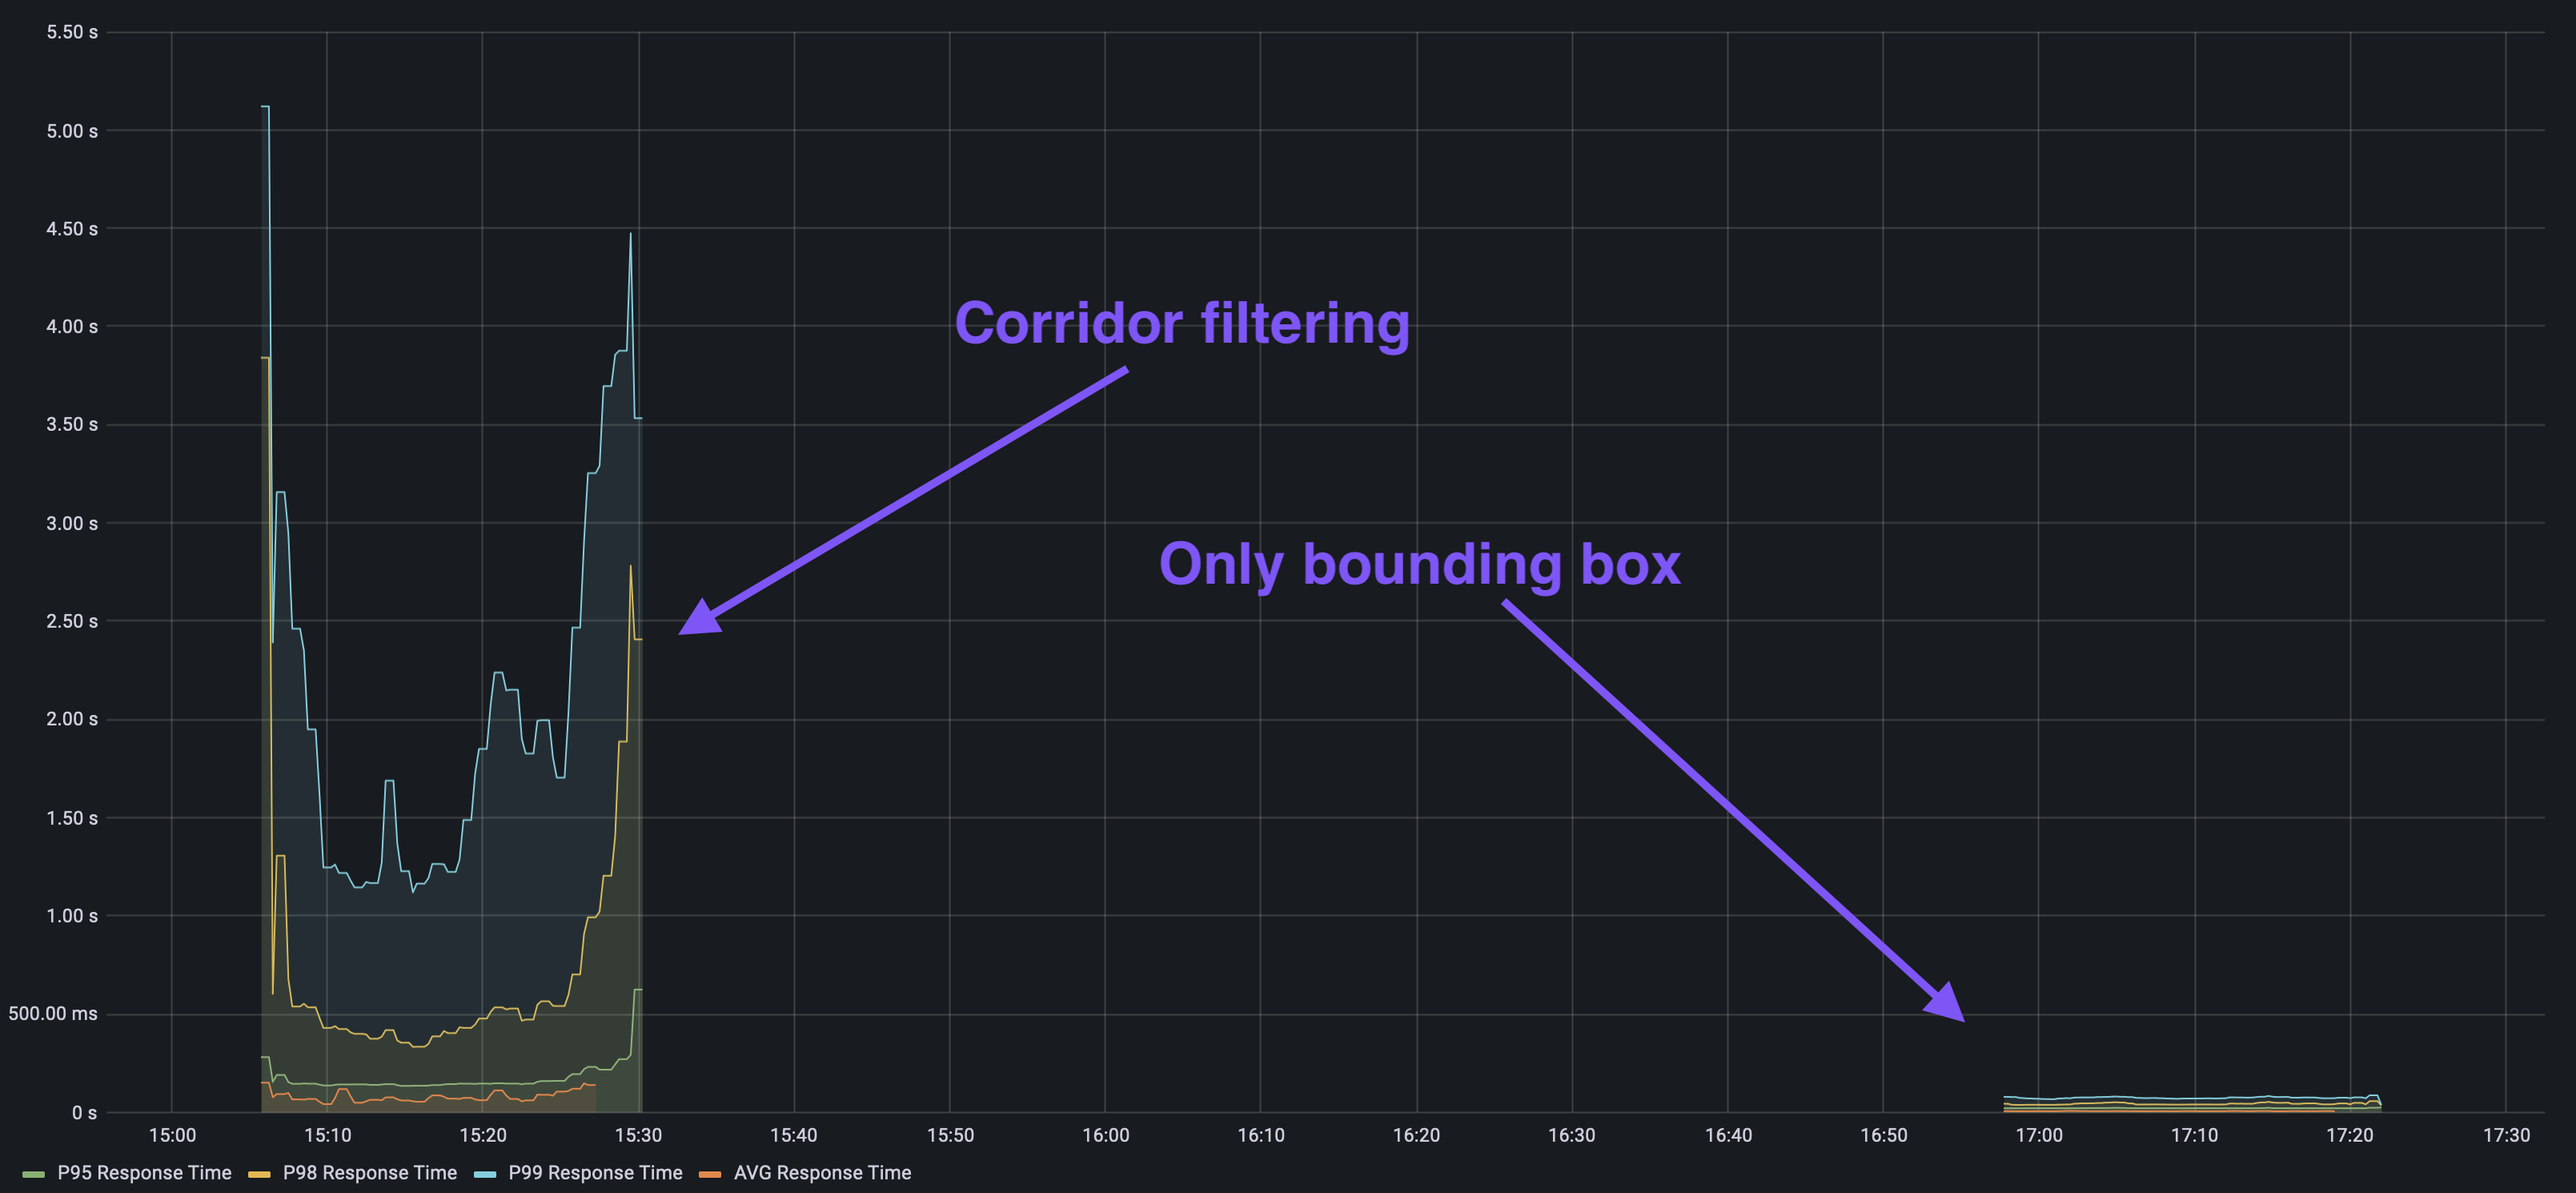
So by removing the filtering, we reduced even the p99 time below 200 milliseconds, whereas both the p98 and the p99 had grown to over 2 seconds in the previous test. Clearly, the filtering was the most expensive part of serving requests. This sort of performance test can be really valuable to test assumptions on real workloads. We have an internally developed tool for this at work, but there are plenty of alternatives available.

We can't just take the filtering out though, our end users expect the results returned to be only those within the corridor, not the ones in a bounding box around the corridor.

We've definitely got an algorithm that needs optimizing. The next question is whether it can be optimized, and for that we need to look at where it's spending time. Let's see how to do that.

flame graphs

Flame Graphs are a visual analysis tool for hierarchical data. As far as I can tell, they were created by Brendan Gregg, and it is certainly his writing on flame graphs and his tool to convert profiling data into interactive SVG flame graphs that has made them popular.

Flame graphs are most commonly used to visualize CPU profiling data (although they're used for all sorts of other measures as well). Where the call stack forms the flames and the width of each section indicates how many samples were recorded in that particular call stack. A flame graph groups all the matching call stacks together, so there is no notion of the series of execution - if you want that, you need a flame chart instead.

Let's illustrate what we expect to see from a flame graph. Here's some simple Rust code:

fn main() {
    // Some work here in main first
    cheap_thing();
    expensive_thing();
}

fn cheap_thing() {
    // Do some light computation here
}

fn expensive_thing() {
    for _ in 0..10_000 {
        expensive_inner();
        more_expensive_inner();
    }
}

fn expensive_inner() {
    // Do some heavy computation here
}

fn more_expensive_inner() {
    // Do some **really** heavy computation here
}

A flame graph for this code might look something like the following.

A flame graph consisting of 3 levels. The bottom level is occupied by a single box labelled main. The second level has a small gap on the left followed by a box occupying roughly 20% of the width labelled cheap_thing and another occupying the rest of the width to the right side labelled expensive_thing. The third level only has boxes on top of expensive_thing, 40% covered by expensive_inner and the remaining 60% covered by more_expensive_inner.

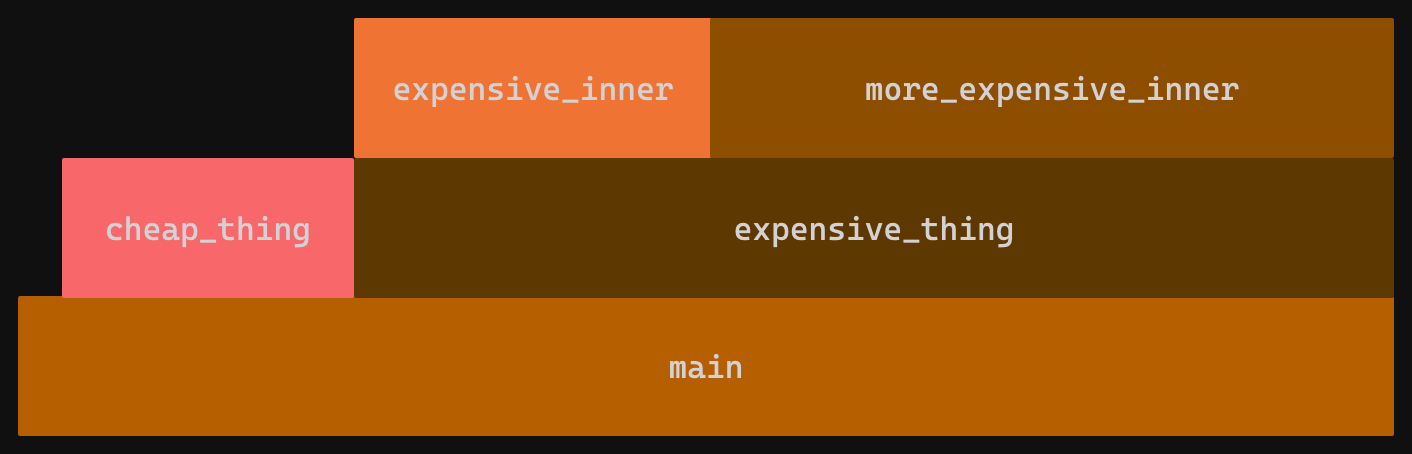
Since the entire execution starts from main(), the bottom level of the flame graph is a single box. The second layer represents functions called from main(). We have a small gap for samples which were taken within main itself corresponding to the comment // Some work here in main first, the rest is covered by a narrower box labelled cheap_thing and a wider box labelled expensive_thing. The wider box indicates more samples were taken there, which corresponds (probabilistically) to the CPU spending more time there. From this flame graph, we see that no samples were recorded in any function called from cheap_thing, but that samples were recorded in the 2 functions called from expensive_thing. Once again, the widths indicate execution time spent in each one.

Of course, real flame charts aren't usually so neat. Amongst other things, main() is actually a series of std library calls.

If we were optimizing this code, we can see that we probably want to start with expensive_thing and the 2 functions it calls.

flamegraph in rust

When I first used flame graphs it was from C++. This usually involved a multistep process where you have to set up a specific (release like) build, profile it with perf, and then convert it to a flame graph SVG with Brendan Gregg's flamegraph.pl (yes, a Perl script).

If you're using Rust, it's much easier these days, you can use the cargo flamegraph command which does all of that for you! The GitHub README also has a good introduction to using flame graphs for system performance work. Now let's install the cargo command.

cargo install flamegraph

It's important to note that you don't want to install cargo-flamegraph which is an old, unmaintained project which does the same thing, but not as complete.

Once it's done, we can run it like any other cargo command.

cargo flamegraph

This will generate a flame graph SVG in your current directory.

To make the graphs more useful, set the following in your Cargo.toml so that your release profile gets debug symbols.

[profile.release]
debug = true

There are plenty of options to modify the sample rate and choose the target you wish to profile. In my case, I had some trouble selecting a unit test from a binary crate and so I ended up moving the code into a separate crate just for the purpose of optimizing it, I then ported the code back. This isn't ideal, but you sometimes end up doing this anyway so that benchmarks can be run on new and old code at the same time (more on that later!).

profiling the corridor filter

Computers are really fast. And even sampling almost 1000 times a second (cargo flamegraph defaults to 997 Hz), we may not get the best picture of where the CPU is spending its time. The easy answer to this is to do it lots of times. We set up our corridor and the points we want to test against, and then execute the filter in a loop. This will give us a more statistically accurate result.

Let's have a look at the result. It's an SVG, so you can render it in a web-site directly (like I'm doing below), but if you open just the SVG in your browser, it's interactive! You can click on boxes in the flame graph to zoom to it and make it occupy the full horizontal width. Try it for yourself by clicking on the image below to open the SVG.

A flame graph of the execution. There aren't a lot of details, it appears that most of the time is spent main, with a reasonable part of that time calling from main directly into sin, cos, and asin functions.

Here we can see that most of the time is spent in main, which is expected. There's a high callstack on the right that takes up some time, if you check the interactive flame graph, you'll see that it's serde related. That's the set up process where we're loading the corridor and points from a JSON file, we can ignore that bit as it's not part of our actual corridor filter implementation.

But then it gets weird. From main it looks like we're calling directly into sin, cos, and asin functions from libsystem_m.dylib (I'm on macOS). We are definitely using these functions (welcome to geocoordinates), but we're not calling them from main. We also see calls to some of these trigonometric functions from outside of main. What's going on?

Inlining! The call stack depends on how our functions have been optimized by the compiler. Because we profile in release mode (with debug symbols), we see optimizations taking place, one of which is inlining.

Inlining is when the compiler takes the contents of a function and rather than keeping it separate and calling into it, inserts it wherever that function is called. For small functions, this often brings a reasonable performance improvement, but it does make performance analysis harder.

In Rust, you can assert some control over this process with the #[inline] attribute. In our case, we want to suggest to the compiler that we would prefer if certain functions were not inlined. For that we do the following:

#[inline(never)]
fn distance_to_segment_m(point: &Point, segment: &[Point; 2]) -> f64 {
    // Function body
}

Let's sprinkle a few of these around and try again. This may make our code slower, but we should still be able to get a better idea of where the time is spent.

A flame graph of the execution. We now see more functions in between main and the trigonometric functions.

That's much better, we can now see more of the call stack. Knowing the code, it still looks a bit odd to me, there are call stacks which seem to be missing intermediate functions. I don't know why this is, but it does seem to happen - performance profiling can be as much an art as a science at times.

So let's look at what we can tell from the flame graph. Looking from the top, we see that 77% of the total execution time was spent inside distance_meters. This is not what I was expecting. That function "just" implements the Haversine formula to calculate the distance between two points. The function does use the trigonometric functions which show up in the flame graph - it seems they are more expensive than we'd thought.

You can see that domain knowledge is important when analyzing the performance of your code (or anyone else's). Often, the biggest challenge is interpreting the results of the performance profiling within the domain you're working in. We'll see this again as we try to optimise this code.

optimizing the corridor filter

We've found out that measuring the distance between two points is the most expensive part of our filter. This wasn't entirely clear from the outset, as when measuring the distance from a point to a line segment, we first need to determine the point on the line segment which is closest to our point.

My gut feeling had been that this is where the performance bottleneck would be - however from our flame graph, we can see that distance_to_segment_m only accounted for 10% of the samples. Take this as a lesson, humans are bad at guessing about performance.

So, what can we do to improve the filter code. When filtering, we have to compare every point (let's say we have N) to all of the line segments in the corridor's polyline (let's say we have M), so we have NM distance calculations. Let's try and reduce that, or at least replace it with something cheaper.

Something cheaper than a distance calculation is a bounding box check. Checking whether or not a point is in a bounding box requires 4 comparison operations, which is much cheaper than the Haversine formula. Or at least we think it is.

As mentioned, for each segment of the corridor, we need to calculate the distance to every point. Let's take the second segment of our corridor and visualize this with the points we used previously.

The polyline for our corridor is shown, but the blue regions representing the radius are only shown for the second segment from the left. The points to filter are shown, only a single point falls within the segment corridor.

We can see that out of the total 8 points, only a single one falls within the corridor for the selected segment. But to determine this, we need to perform 8 distance calculations.

Instead, let's draw a bounding box around the corridor segment. Calculating the bounding box for that segment is likely not much more expensive than a distance calculation, but once done we can use it for all points. Let's visualize what this would look like.

The polyline for our corridor is shown, but the blue regions representing the radius are only shown for the second segment from the left. A purple bounding box is shown around the segment corridor. The points to filter are shown, now there are 3 points that fall within the segment bounding box.

Now we see that 3 points fall inside the bounding box, the single point that is in the segment corridor as well as 2 more which aren't. This is a pre-filter, we still need to calculate the distance from these 3 points to the segment, but for the remaining 5 points which are outside the bounding box, that calculation can be skipped.

Of course, this is all very nice in theory, but before we start running our full service performance tests, it would be nice to see how our bounding box pre-filter performs compared to the baseline corridor filter. For this we're going to run some benchmarks!

benchmarking with divan

While optimizing our corridor filter we said "calculating the bounding box for that segment is likely not much more expensive than a distance calculation". It's OK to implement something based on your understanding of how expensive the computation is, but afterwards it's best to go back and validate that understanding - you'll often be surprised!

Now that we have our optimized corridor filter, we're going to compare it with the baseline. For this, I'm going to use Divan. Criterion is probably the go-to benchmarking library for Rust, but I wanted to try Divan because I'd heard about it from the creator, Nikolai Vazquez, at RustLab last year. I won't go into comparing the two options, because I have never used Criterion.

The set up is pretty straight forward and is described in this blog post. Create a file in the benches directory of your crate with a very small amount of boilerplate.

fn main() {
    divan::main();
}

#[divan::bench]
fn some_benchmark() {
    // do things here
}

One thing that I completely missed when I started using Divan is that you also need to update your Cargo.toml to include the bench.

[[bench]]
name = "benchmark"
harness = false

This is apparently also true for Criterion, and it's because the value for harness is true by default, but actually using Cargo's own bench support requires nightly.

To get a reasonable spread of benchmark results, we set up 4 scenarios. We have corridors of different numbers of points and varying numbers of "locations", each location is made up of various points. For each scenario we consider the number of locations to be filtered and the total number that fall within the corridor.

  • small_corridor: 4 point corridor, 13/15 locations match
  • medium_corridor: 109 point corridor, 70/221 locations match
  • long_narrow_corridor_few_total: 300 point corridor, 34/65 locations match
  • long_corridor_many_filtered: 251 point corridor, 251/2547 locations match

I like the way that Divan allows you to organize benchmarks in modules. So for the first scenario, the benchmark file would be organized in the following manner.

mod small_corridor {
    use super::*;

    #[divan::bench]
    fn baseline(bencher: divan::Bencher) {
        // bench code
    }

    #[divan::bench]
    fn pre_bbox(bencher: divan::Bencher) {
        // bench code
    }
}

And then we'd do the same for the other 3 scenarios. These can all be added to the same bench file, with a single main function.

The scenarios with longer corridors take a reasonable amount of time to execute, so the default 100 iterations that Divan uses would take too long. Those were reduced to 10 and 20 iterations respectively. Now, let's look at the results (using release profile of course)!

$ cargo bench --bench corridors --profile=release
Timer precision: 38 ns
corridors                           fastest       │ slowest       │ median        │ mean          │ samples │ iters
├─ long_corridor_many_filtered_out                │               │               │               │         │
│  ├─ baseline                      5.77 s        │ 6.86 s        │ 6.303 s       │ 6.257 s       │ 10      │ 10
│  ╰─ pre_bbox                      46.71 ms      │ 64.12 ms      │ 51.36 ms      │ 52.73 ms      │ 10      │ 10
├─ long_narrow_corridor_few_total                 │               │               │               │         │
│  ├─ baseline                      55.87 ms      │ 79.23 ms      │ 65.06 ms      │ 66.95 ms      │ 20      │ 20
│  ╰─ pre_bbox                      505.6 µs      │ 812.4 µs      │ 612.1 µs      │ 646.2 µs      │ 20      │ 20
├─ medium_corridor                                │               │               │               │         │
│  ├─ baseline                      62.62 ms      │ 91.11 ms      │ 73.88 ms      │ 74.38 ms      │ 100     │ 100
│  ╰─ pre_bbox                      548.9 µs      │ 1.183 ms      │ 689.9 µs      │ 692 µs        │ 100     │ 100
╰─ small_corridor                                 │               │               │               │         │
   ├─ baseline                      137.3 µs      │ 282.4 µs      │ 169.3 µs      │ 177.3 µs      │ 100     │ 100
   ╰─ pre_bbox                      17.07 µs      │ 52.57 µs      │ 21.19 µs      │ 23.22 µs      │ 100     │ 100

The results were better than we had expected. As you can see, we saw a 100x speed up in all cases except the small corridor, but even in that scenario there was a 5x to 8x speed up. Our optimization made the worst case scenarios significantly better and even gave a reasonable improvement in the smallest scenario where optimizations attempts could potentially lead to worse performance. And we know all this because of the benchmarking, instead of just guessing!

Now that we have some confidence in our changes, let's compare them in the same performance tests that we used at the beginning. Note that "old" and "new" have switched sides compared to the first latency graph that I showed.

A time series graph showing average, p95, p98, and p99 response times. There are two separate sets of lines (executed at different times, with a gap in the middle), the ones on the left are labelled "Pre-filtering with bounding box" and the ones on the right are labelled "Old corridor filtering".

Again, the results are impressive. The same performance test turned huge latency peaks into what looks like a flat line. Now we're good to go to production with confidence (and the right monitoring strategy).

so it went to production, right?

Well..., no. Or, kind of.

I've skipped over some details that had nothing to do with the performance optimization. Let's fill them in.

This service is made up of two parts, a front-end service (Rust) which deals with HTTP requests from end users and then forwards the request onto a back-end service (C++) which contains the indexed data.

The corridor filtering is performed on the back-end service, the one with the index data. But the back-end service scales slowly, whereas the front-end service scales much faster (shorter pod start-up time) and is cheaper. So it made sense to consider moving the expensive filtering function to the front-end service. Because the filtering was so expensive, it was cheaper for the back-end service to serialize additional elements that were going to be filtered out, rather than doing the filtering itself. We could instead filter on the cheaper front-end service.

And that was true, until we optimized the filtering code and saw how much faster it became. At that point we ported the changes back to the original C++ code and left the filtering where it was in the back-end service.

After porting the filtering optimizations to the back-end service, it became less expensive to filter than to serialize the additional elements which would be filtered out. In the end the results were good. Latency is down and so are costs, so it's win-win.

final words

If I was reading this post without any prior knowledge, I think I'd feel a little disappointed. It all seemed like a lot of extra work for something that turned out to be easy. After all, our first optimization attempt resulted in a 100x speed up and then we stopped there.

However, my experience is that this is often the case. The trick here was a combination of profiling and domain knowledge driven intuition. My initial assumption about where to optimize was incorrect, but I never tried implementing that because the profiling results pointed me in another direction.

But once I had the direction, I could apply my own domain experience to the problem and guess at a solution. The benchmarking quickly showed me that the first guess did provide a reduction in execution time. In this write up I skipped the bit where we started benchmarking before we had all the functional test cases passing - because if it wasn't faster, we weren't going to bother fixing edge cases.

As I said earlier, performance optimization is sometimes as much an art as a science, but you need both parts to be effective.

commit message rant (part 1 of n)

on Monday, 18 March 2024

The other day I was setting up release automation for a Rust project. Everything was going great and I'm happy with the release tooling I'm trying out. Then it got to creating the release PR. This looks great, it includes all the information about the release. The version that's being released, a changelog (which is customizable), as well as a link to the commits in the latest version. Here's an example from a test project:

Screenshot of a GitHub Pull Request description. It specifies that the crate hds_test0 will go from version 0.0.3 to 0.0.4 and provides a list of changes of which there are 2.

Fantastic, all the information that I need in one place. A summary of the changes that have gone into the release as well as the version number that these changes will be released with. Then I go to the subsequent commit message and it looks like this:

chore: release (#6)

Signed-off-by: github-actions[bot] <41898282+github-actions[bot]@users.noreply.github.com>
Co-authored-by: github-actions[bot] <41898282+github-actions[bot]@users.noreply.github.com>

All that wonderful information, all that rich context, gone! Blown away onto the wind. Or rather, trapped in a dark room with a door that only sort of works (see but it's already somewhere else and the tooling is fighting you).

Now is the part where I have to apologise to Marco Ieni, the author of the fantastic release-plz project. I don't want to take aim at Marco specifically, it was just that this experience perfectly highlighted the general trend to not include important information in commit messages.

Note to self: open an issue on release-plz to include more detailed information in the commit message. (done: #1355)

rant

This rant is a long time coming, and it may be the first of many, but it might be a bit, ... ranty. Don't say I didn't warn you.

These days, I would wager that a very large percentage of the readers of this site use Git, for better or worse it has become ubiquitous in much of the industry and perhaps even more so in the open source world. I'm going to use Git as an example throughout this post, but everything I say applies to every other source code management / version control system that is worth using. I'd even go so far as to say that any system that doesn't allow the sort of access to commit messages that I'll describe is actively working against your best interests.

Commit messages are the most durable store of information that any software project has. When you clone (or checkout) a project, the commit messages are right there. Every member of your team has a local copy. Accessing commit messages is simple and extracting them from the rest of the repository is not much more complicated.

So why would you waste this fantastic store of information with commit messages like:

Fix NullPointerException

Sorry! This is a Rust blog:

Fix unwrap panic

You may laugh and say no one ever does this. But I ran a search on a private GitLab instance I have access to and found 2.5K commits where the message was some variation of this with no more information! Interestingly I found a few results for "panic" as well, but the results were a little more varied (some of them were related to aborting on panic and many more related to terraform). Still, very few had any actual commit message. Part of the fault of this is GitLab itself, but we'll go into that later (the tooling is fighting you).

This isn't very useful, I could probably work out for myself that a NullPointerException panic was being fixed from the code. What is interesting is why this change was needed. What are the assumptions which were previously made, but have now been discovered to be incorrect? This is the information that will be useful both for the code review, but also later on once everyone has forgotten.

what should a commit message contain?

In one word: context.

This topic was covered wonderfully by Derek Prior (the principal engineering manager at GitHub, not the fantasy book author by the same name) in his 2015 RailsConf talk Implementing a Strong Code-Review Culture. If you haven't seen that talk, it is well worth watching.

To summarise, a commit message should contain the why and the what. Why was a change necessary? Why was it implemented the way it was? Why were those tools used chosen? What was changed? What benefits and and down-sides does the implementation have? What was left out of this particular change? (and why?)

If you're the sort of person who writes a single line summary and leaves it at that (we've all been that person), start by making yourself write two paragraphs in the body of the commit message for every commit. (1) Why was this change made. (2) What does this change do.

And all of this should be in the commit message. (want to see an example?)

You should also definitely link the issue, ticket, or whatever it is that you use to prioritize work. But that is part of the why, not all of it.

And yes, I can hear many of you saying...

but it's already somewhere else!

There are people screaming, this is already written down! It's in the ticket! It's in the Pull Request description! It's written on a sticky note on the side of the server! (you'd be surprised)

I'm sure you have this information written down, but there are two reasons why the commit message is a much better place for this information - even if that means duplicating it.

The first is persistence. As mentioned above, commit history is a distributed store of information, there are redundant copies on every developer's machine. It doesn't matter if you lose your internet connection, you've still got the commit history and all those wonderful commit messages.

Your ticketing system does not have these properties. GitHub (or GitLab or Codeberg) does not have these properties.

I've seen JIRA projects get deleted for all sorts of reasons.

  • "It's confusing keeping this old project around, people will create tickets for us there, let's just delete it."
  • "We're migrating to a new instance with a simpler configuration, migrating all the tickets is too complex, it's better to start afresh."
  • "JIRA is too complex, we're moving to a simpler solution that covers all our needs, no, we can't import our closed tickets."

GitHub has been a staple of open source development for a decade and a half now. But many open source projects have lived much longer than that. GitHub won't be around for ever, and when it comes time to migrate to whatever solution we find afterwards, pulling all the PR and Issue descriptions out of the API is likely to be something that many maintainers simply don't have time for.

I challenge you to find a semi-mature engineering team that will accept migrating to a new version control system that doesn't allow them to import their history from Git/Mecurial/SVN/...

Keeping that valuable information behind someone else's API when you could have it on everyone's development machine seems crazy.

The second reason is cognitive. There is no person in the history of time and the universe who understands a change better than the you who just finished writing it and runs git commit. So this is the person who should describe the changes made. Not the Product Owner who wrote the user story, not the Principal Engineer who developed the overall architecture, you the developer who just finished writing the code itself. And it's probably all right at the front of your head as well, ready to be spilled out into your text editor.

If you amend your commit as you work, then you can amend the message as well, keeping it up to date with the changes in that commit. If you prefer to develop in separate commits, then ensure that each commit contains a full picture of the code up until that point. You don't want to be scratching your head trying to remember why you picked one of three different patterns for that one bit of logic you wrote last week.

A Pull Request description has many of these benefits, but it lacks the persistence and accessibility as mentioned above.

the tooling is fighting you

Like all those social media and app store walled gardens that we love to hate, source code management software and ticketing systems want to lock you in.

Aside from the obtuse APIs they often provide to access this data, some of them are actively "forgetting" to add important information to merged commit messages.

GitHub encourages you to add your commit message as the PR description - but only the first commit when the PR is created. Then the default merge (as in merging a branch) message contains none of that PR description - so you're left with whatever development history the branch has. And "Fixed tests" is not a useful commit message to find anywhere.

At least GitHub squash merges include all the commit messages of the squashed commits by default (as little use as that often is). By default, when GitLab creates a squash merge it will include the summary taken from the Merge Request title and then for the message body: nothing at all! This is actually one of the reasons why my search results turned up so many commits with no message body.

Ironically (because people love to hate it), Gerrit is the one piece of source code management software that does commit messages correctly. Commit messages show up as the first modified file in a changeset. The commit message can be commented on like any changed file. When the merge occurs, the commit message that has been reviewed is what gets included.

Linking to a ticket (issue) is a good idea. But also mention other tickets related to previous or upcoming changes that the implementation had to take into consideration. When you lose access to those tickets, this extra information can help find other relevant changes as your poor successors (maybe including future you) are going about software archaeology.

show me an example

Let's looks at an example.

BLAH-2140: Use least request balancing

We have a ticket number, so maybe there's some useful information there. Oh, too late, the ticketing system was migrated 3 years ago, we didn't keep old tickets.

Wouldn't it be better if we had a bit more context?

BLAH-2140: Use least request balancing in Envoy

We had reports of latency spikes from some customers (BLAH-2138). The
investigation led to us noticing that the Info Cache Service (ICS) pods
did not appear to be equally loaded.

As our front-end pods communicate with the ICS pods via gRPC, we perform
client side load balancing using Envoy Proxy
(https://www.envoyproxy.io/) as native Kubernetes load balancing doesn't
support HTTP/2 (see investigation in BLAH-1971).

Since our incoming requests often require significantly different
processing time on the ICS pods, the round robin load balancer in
Envoy was overloading some pods. The documentation suggests that in
this case, using the least request strategy is a better fit:
https://www.envoyproxy.io/docs/envoy/v1.15.5/intro/arch_overview/upstream/load_balancing/load_balancers

The experimental testing we performed confirmed this configuration.
The results are available at:
https://wiki.in.example.com/team/ics/load-balancer-comparison/

This change switches the load balancing strategy used in Envoy sidecar
container (in the trasa pods) to use weighted least request.

First, we make our summary a little more descriptive. We're using Envoy for load balancing, let's have that right up there.

Then we start with the reason why we're making any change at all, we've had bug reports and we found a problem. Following that, we have a bit of history. This will save anyone who is reading the commit message having to go hunting down the reason we're even using Envoy. Note that when we say that we're using some software, we link to the web-site. This isn't a lot of work and provides clarity in case some other Envoy software exists in 3 years time.

Now we describe the approach chosen. We link the documentation that we read as justification for our change - and we link to the version we're using and not latest! We follow this by explicitly stating that experimental testing was performed (this removes the doubt in the reader's mind that this change was shipped to be tested in production) and we link to our internal wiki for that.

At the end, we describe what has been changed. This paragraph is short in this case, because the change itself is only one line, if your change is more complex, you may want to spend more time summarising it.

While this may look like a large description for what is ultimately a small change, the effort involved in deciding on the change was significant. And that's the key, the metric for deciding upon how descriptive a commit message should be is the time taken to come to the right solution, not the number of lines changed.

signing off

Some code review platforms like to add meta information to the commit message. For example, listing the authors of different commits that went into a reviewed change, or the names of the reviewers.

This might be useful, but naming names is the least valuable information (and is usually hiding the fact that the knowledge those named have isn't properly transferred to the commit message itself).

In my mind, the the real reason to call it git annotate instead of git blame is that the person it wrote a change is the least interesting thing. It's all the context that should be included in a good commit message which is going to annotate your code.

the end (for now)

Commit messages are an important part of communicating with developers who will work on a code base in the future. They are far more robust that than most other stores of information (tickets, wikis, etc.).

Next time you don't write a detailed, useful commit message, think about what those 5 minutes you saved is going to cost someone in the future.

rust but async

on Tuesday, 27 February 2024

One of the things that is said about Rust is that it's the result of paying attention to the last 30 years of research into programming language design. This is probably being unfair to some other languages - even if only by omission. However, we can say that Rust has definitely made the right choices in some places where no widely successful programming language has done before.

One of the other reasons for Rust's success up until now is likely the broad range of areas in which it can be used. Yes, you can use it for systems programming, but Rust is also a great choice for writing a command line tool, a backend web application, and of course game development is in there as well. It may well be this broad applicability that has given Rust the critical mass necessary to be successful without a large tech company basically forcing it upon developers. Swift is the obvious case here, but Kotlin fits the mold and even Go when it comes to using Kubernetes.

That is an interesting lens to look at Mojo through.

rust, but for AI

Mojo is a new programming language from Modular a company co-founded by Chris Lattner. Lattner created LLVM (the compiler toolchain that Rust uses as a backend) as part of his master research and then later worked at Apple where he created Swift.

For me, the interesting thing about Mojo is the way it is being positioned. On the one hand, the landing page calls it "the programming language for all AI developers" (emphasis is theirs). On the other hand, a recent blog post from the Modular compares Mojo to Rust, mostly in terms of developer ergonomics and execution performance. What I took away from that blog post is that Modular is positioning Mojo as Rust, but for AI.

This is based on Modular running an AI platform and the linked blog post putting a lot of emphasis on both AI use cases and the reticence of data scientists to learn a language that is different from their primary tool today, which is Python. From this point of view, the Rust, but for AI argument makes sense (when talking to a certain audience). Today, much of AI/ML and data science in general run on Python for the front end and C/C++ for the backend because Python is too slow. There aren't a lot of languages in a position to insert themselves there, but Rust could become one - after a bunch of necessary work, especially on the GPU side.

This specificity seems to go against one of the things that I believe has made Rust successful. But Mojo will have the corporate push (and may have the right niche) to build Mojo up despite this.

rust, but for X

This leads to the whole point of this post. If you could have Rust, but for something in particular, then you could probably cut corners to improve the language for that use case - the flip side is that you may make it unusable for other uses cases.

One of the things I use Rust for is backend services (that serve stuff, what stuff isn't really important). In 2024 that (mostly) means concurrent programming, which means async Rust. So what if we took Rust and made another programming language, one that sacrificed other use cases and made it the best possible Async Rust. What would that look like?

asr

For lack of a better name, let's call this language ASR (something like ASyncRust - whatever, you can call it a better name in your head if you like).

ASR is the same as Rust, but with a few small (or kind of small) changes.

everything async

Let's go back to that famous blog post What Color is Your Function?. It posits that async-await in Javascript helps (but doesn't completely solve) the problem with async functions there (and in many other languages), which is that you have to treat async functions (red) differently from normal functions (blue). And the worst thing is, while you can call a normal (blue) function from an async (red) function, you can't do it the other way around. Which is true in async Rust and often a cause of problems.

So let's just do away with "normal" functions. In ASR, we'll make everything async instead. There is no async-await syntax either, because all functions are async and every time you call a function there is some implied awaiting happening.

Of course, all these async functions are actually still futures underneath - if you want to know more about how that works, start with how I finally understood async/await in Rust (part 1).

We're going to depend on a smart compiler to optimise some of this away for us, in the same way that we depend on the compiler to optimise away some function calls by inlining.

async clean-up

Boats has been discussing a number of API concerns regarding async recently (well, for longer than that, but their posts have been coming thick and fast this month). The latest of those at the time of writing discusses Asynchronous clean-up.

The article goes into great depth in a proposed solution, but a lot of the problems stem from async functions being different to normal functions. For example, a type with an async drop function can only be dropped in an async context - something which Rust doesn't currently have a way to check for (although the type system could likely support it in the future). This particular problem goes away in ASR, where everything is async - since nothing happens outside an async context. There are nuances of course, but making everything async simplifies at least some problems.

structure

Rust's async-await syntax hides a lot of the complication of manually writing futures. This is especially true when it comes to holding references across await points (which turns into storing references inside a future). Just try implementing that manually and you'll see what I mean. However, borrowing becomes impossible once you start spawning tasks.

Tokio's spawn requires that the future being spawned is 'static (and smol and async-std have the same requirement). This means that it can't borrow anything from the surrounding context. The only way to pass references in is to Arc it up.

For OS threads, the Rust standard library solves this problem with scoped threads, but the fact that futures can be cancelled means that the same solution doesn't extend to concurrent programming in Rust.

One solution to this problem would be structured concurrency. This is not a new idea and is already the standard in Kotlin and Swift. With Rust's borrow checker, one would think that structured concurrency would be a natural fit, but it's not something that has yet found its way to a mainstream Rust async crate.

With structured concurrency in ASR, we will ensure that parent tasks outlive their child tasks. For one, this would mean that if a parent task is cancelled, all its child tasks get cancelled before the parent task is truly cancelled (and dropped). In turn, this would allow us to propagate lifetimes to child tasks, removing the restriction that only 'static futures can be spawned.

This is the one idea from this rant that I think is probably most interesting to explore in Rust today.

what rust do you want?

That's more than enough pseudo language design from me for now.

As much as I am interested to hear all the ways in which the ideas I've presented in this post are impossible, I would be much more interested to hear what your own derivative of Rust would look like. Remember, dreaming is free!

debugging tokio instrumentation

on Tuesday, 30 January 2024

I contribute to tokio-console. One of the things that I often find myself doing is matching what is shown in the console with the "raw" tracing output that comes from Tokio. However, this is pretty hard to read and doesn't actually contain all the information that I need.

There are a couple of things that I'd like to have. Firstly (and most importantly), I need to see Tracing's internal span::Id for the spans that are emitted. This is something which the fmt::Subscriber (and underlying Layer) don't support. And rightly so - it's internal information. But it's used heavily in the instrumentation in Tokio and to debug, I really need to have it available.

Normally, to get this information I use a patched version of the tracing-subscriber crate. But this is something that can't be checked into the console project, and setting it up each time is a bit tedious.

Secondly, I'd like to be able to visually differentiate the specific spans and events used in Tokio's instrumentation. Unlike the internal span ID, this is entirely domain specific, and has no use outside of this specific use case.

Here's a snippet of output from the fmt::Subscriber outputting some of Tokio's instrumentation.

2024-01-31T09:23:11.247690Z  INFO runtime.spawn{kind=task task.name= task.id=18 loc.file="src/bin/initial-example.rs" loc.line=11 loc.col=5}: initial_example: pre-yield fun=true
2024-01-31T09:23:11.247703Z TRACE runtime.spawn{kind=task task.name= task.id=18 loc.file="src/bin/initial-example.rs" loc.line=11 loc.col=5}: tokio::task::waker: op="waker.clone" task.id=2
2024-01-31T09:23:11.247717Z TRACE runtime.spawn{kind=task task.name= task.id=18 loc.file="src/bin/initial-example.rs" loc.line=11 loc.col=5}: tokio::task: exit
2024-01-31T09:23:11.247737Z TRACE tokio::task::waker: op="waker.wake" task.id=2
2024-01-31T09:23:11.247754Z TRACE runtime.spawn{kind=task task.name= task.id=18 loc.file="src/bin/initial-example.rs" loc.line=11 loc.col=5}: tokio::task: enter
2024-01-31T09:23:11.247766Z TRACE runtime.resource{concrete_type="Barrier" kind="Sync" loc.file="src/bin/initial-example.rs" loc.line=9 loc.col=39}: tokio::sync::barrier: enter
2024-01-31T09:23:11.247800Z TRACE runtime.resource{concrete_type="Barrier" kind="Sync" loc.file="src/bin/initial-example.rs" loc.line=9 loc.col=39}:runtime.resource.async_op{source="Barrier::wait" inherits_child_attrs=false}: tokio::util::trace: new

There is a lot of information here, and distinguishing different spans types can be complicated (especially when you're scanning through dozens or even hundreds of lines). Additionally, the span::Id is completely absent.

Compare this to the output of the same section of logs coloured and including the span::Id right after the span name.

2024-01-31T09:23:39.136879Z  INFO runtime.spawn[2]{kind=task, task.name=, task.id=18, loc.file="src/bin/initial-example.rs", loc.line=18, loc.col=5} initial_example: fun=true pre-yield
2024-01-31T09:23:39.136937Z TRACE runtime.spawn[2]{kind=task, task.name=, task.id=18, loc.file="src/bin/initial-example.rs", loc.line=18, loc.col=5} tokio::task::waker: op="waker.clone", task.id=2
2024-01-31T09:23:39.136995Z TRACE runtime.spawn[2]{kind=task, task.name=, task.id=18, loc.file="src/bin/initial-example.rs", loc.line=18, loc.col=5} exit
2024-01-31T09:23:39.137059Z TRACE tokio::task::waker: op="waker.wake", task.id=2
2024-01-31T09:23:39.137122Z TRACE runtime.spawn[2]{kind=task, task.name=, task.id=18, loc.file="src/bin/initial-example.rs", loc.line=18, loc.col=5} enter
2024-01-31T09:23:39.137212Z TRACE runtime.resource[1]{concrete_type="Barrier", kind="Sync", loc.file="src/bin/initial-example.rs", loc.line=16, loc.col=39} enter
2024-01-31T09:23:39.137296Z TRACE runtime.resource[1]{concrete_type="Barrier", kind="Sync", loc.file="src/bin/initial-example.rs", loc.line=16, loc.col=39} runtime.resource.async_op[274877906945]{source="Barrier::wait", inherits_child_attrs=false} new

Having now justified something I wanted to do anyway, let's build our own custom tracing subscriber!

(actually, it's going to mostly be a Layer)

aside: tracing subscribers and layers

If you're already familiar with tracing, you may wish to skip this section and go straight to ari-subscriber.

In the tracing ecosystem, you need a subscriber to actually do anything other than send your traces into the void. Specifically something that implements the Subscriber trait. A subscriber can take the traces and do what it wishes. Write them to stdout, to a file, collect them and perform aggregation, send them to another service (maybe via Open Telemetry).

The tracing-subscriber crate provides a number of subscriber implementations. From the outside, this mostly looks like different ways to write traces to a file handle. However, the real heart of tracing-subscriber is the registry. The registry is a subscriber which implements a span store and allows multiple layers to connect to it.

What is a Layer? For the longest time I had real trouble understanding conceptually what a layer is. From the documentation, a layer is "a composable abstraction for building Subscribers". However, I struggled to understand how I may wish to compose layers. It's also confusing because layers don't feed into other layers the way that tower layers do (which are like middleware, in that what one layer does affects what the next layer receives).

Instead, think of layers as mini-subscribers. They can take action on some methods on the Layer trait, but can fall back to the default implementation for things that they're not interested in. And Layer has a default implementation for everything.

Most layers need to store information about spans, this is where the registry comes in (specifically via the LookupSpan trait). Layers can store their own data in the registry in the form of span extensions.

The reason why storing this data in the registry is important may not be immediately obvious.

It's because tracing itself doesn't store this data. This allows tracing to not allocate for the data and therefore be used in no_std environments as well as the giant servers and beefy development machines that many of us are accustomed to.

Here's an example for clarity. When a span is created, a Subscriber receives a call to new_span(). This includes the span Attributes which gives the subscriber access to all the information about that span. Its metadata, field names, and also the values of any fields that were set at the time of creation.

This is great, it's everything we could need!

Now let's look at the method that gets called when a span is entered (becomes active), this is called [enter()] and all it comes with is... a span::Id. No metadata, no field names, and certainly no field values. And this pattern repeats on the trait methods called when a span exits or is closed.

Using the registry to store whatever data a layer might need about a span later on is the solution. This allows the fmt::Subscriber to print out the full data for each span in an event's ancestry.

Now that we understand a bit about what subscribers and layers are, let’s get into implementing some of it!

ari-subscriber

To meet the needs of my use-case, as described above, I've written the ari-subscriber crate. It's currently at version 0.0.1, which indicates that it's probably a bit rough, but so far it's already helped me quickly narrow down the version of Tokio after which yield_now() doesn't get detected as a self wake by Tokio Console.

The “ari” in ari-subscriber is for “async runtime instrumentation”.

The interface is simple, you pass an ari-subscriber layer to the registry:

use tracing_subscriber::prelude::*;
tracing_subscriber::registry()
    .with(ari_subscriber::layer())
    .init();

This will write output to stdout (currently not configurable). And the output will have pretty colours!

Let's look at a simple example of how we can use ari-subscriber. Here's the Rust code we'll be using:

#[tokio::main]
async fn main() {
    // Set up subscriber
    use tracing_subscriber::prelude::*;
    tracing_subscriber::registry()
        .with(ari_subscriber::layer())
        .init();

    // Spawn a task and wait for it to complete
    tokio::spawn(async {
        tracing::info!(fun = true, "pre-yield");
        tokio::task::yield_now().await;
    })
    .await
    .unwrap();
}

We start in an async context (using the #[tokio::main] attribute). First we set up the ari-subscriber layer with the registry. Then we spawn a task and wait for it to complete. The task emits a tracing event and then returns control to the runtime by calling the yield_now() function from Tokio. After that it ends

If you've been watching closely (and following all the links I've been sprinkling around), you may have realised that I'm looking at the case described in the issue console#512. What we want to look at is where the wake operation occurs.

We're going to fix our version of Tokio to an old one, where we know that Tokio Console detects awaiting on yield_now() as a self-wake. So let's specify the following in our Cargo.toml:

[dependencies]
ari-subscriber = "0.0.1"
tokio = { version = "=1.22.0", features = ["full", "tracing"] }
tracing = "0.1.40"
tracing-subscriber = "0.3.18"

We set the version of Tokio to =1.22.0, this indicates that we want exactly this version. By default, cargo would take any 1.x version where x is greater than or equal to 22.

Now let's look at the output (truncated a little bit to remove things that we won't be focusing on).

2024-01-30T15:43:24.010351Z TRACE runtime.spawn[1]{kind=task, task.name=, task.id=18, loc.file="src/main.rs", loc.line=10, loc.col=5} new
2024-01-30T15:43:24.010695Z TRACE runtime.spawn[1]{kind=task, task.name=, task.id=18, loc.file="src/main.rs", loc.line=10, loc.col=5} enter
2024-01-30T15:43:24.010778Z  INFO runtime.spawn[1]{kind=task, task.name=, task.id=18, loc.file="src/main.rs", loc.line=10, loc.col=5} debugging_tokio_instrumentation: fun=true pre-yield
2024-01-30T15:43:24.010829Z TRACE runtime.spawn[1]{kind=task, task.name=, task.id=18, loc.file="src/main.rs", loc.line=10, loc.col=5} tokio::task::waker: op="waker.wake_by_ref", task.id=1
2024-01-30T15:43:24.010878Z TRACE runtime.spawn[1]{kind=task, task.name=, task.id=18, loc.file="src/main.rs", loc.line=10, loc.col=5} exit
2024-01-30T15:43:24.010924Z TRACE runtime.spawn[1]{kind=task, task.name=, task.id=18, loc.file="src/main.rs", loc.line=10, loc.col=5} enter
2024-01-30T15:43:24.010962Z TRACE runtime.spawn[1]{kind=task, task.name=, task.id=18, loc.file="src/main.rs", loc.line=10, loc.col=5} exit
2024-01-30T15:43:24.010997Z TRACE runtime.spawn[1]{kind=task, task.name=, task.id=18, loc.file="src/main.rs", loc.line=10, loc.col=5} enter
2024-01-30T15:43:24.011032Z TRACE runtime.spawn[1]{kind=task, task.name=, task.id=18, loc.file="src/main.rs", loc.line=10, loc.col=5} exit
2024-01-30T15:43:24.011065Z TRACE runtime.spawn[1]{kind=task, task.name=, task.id=18, loc.file="src/main.rs", loc.line=10, loc.col=5} close

Unfortunately it's way to wide to visualise nicely on this web-site. But let's walk through it.

The date and time and log level is pretty straight forward. I took the log level colours from the fmt::Subscriber, so those should be familiar.

trace types

All the lines in the output are prefixed with a span named runtime.spawn. Spans with this name instrument tasks, ari-subscriber colours them green. There are district types of instrumentation in Tokio, and they each get their own colour.

  • runtime.spawn spans (green) instrument tasks
  • runtime.resource spans (red) instrument resources
  • runtime.resource.async_op spans (blue) instrument async operations
  • runtime.resource.async_op.poll spans (yellow) instrument the individual polls on async operations
  • tokio::task::waker events (purple) represent discrete waker operations
  • runtime::resource::poll_op events (orange) represent poll state changes
  • runtime::resource::state_update events (pink) represent resource state changes
  • runtime::resource::async_op::state_update events (turquoise) represent async operation state changes

In the case of spans, the value given above is the span name, for events it is the target.

Describing how each of these traces is used within Tokio and how to interpret them would fill several more posts and I won't go into that topic in more detail here. I already wrote a post on the instrumentation for tasks, which covers the runtime.spawn spans and the tokio::task::waker events. Go read tracing tokio tasks to learn about those!

span events

Now let's get back to the output of ari-subscriber for our test program. The first line ends in new, this is an event representing the creation of a new span. There are equivalent lines for enter, exit, and close; all parts of the span lifecycle. See the span lifecycle section of the post I linked above for a refresher on the lifecycle.

By default, the fmt::Subscriber doesn't output these "span events", but it can be configured to do so with the with_span_events() method on the builder. Currently ari-subscriber always emits these span events, but I may wish to make this configurable in the future to reduce the amount of output.

analysing wakes

Let's find our wake operation. You'll notice that there is exactly one line at INFO level. This is the one that we added to our spawned task ourselves. After the runtime.spawn span we see the text

debugging_tokio_instrumentation: fun=true pre-yield

The first bit (debugging_tokio_instrumentation) is the target, which by default is the same as the module path so it's the name of our example application. After the colon are the fields (just one field: fun=true) and finally the message (pre-yield). An event's message is actually just a specially handled field with the name message. This event isn't coloured because it isn't part of the instrumentation that ari-subscriber knows about.

The next line is the wake operation (it's purple!). We can see that its target is tokio::task::waker and then it has 2 fields and no message. The fields are op="waker.wake_by_ref" and task.id=1.

Let's start with the second field, task.id=1. This gives the instrumentation ID of the task being woken. The instrumentation ID of a task is not the Tokio task::Id, but rather the tracing span::Id of the span which instruments that task. That value is the one that appears in brackets after the span name runtime.spawn (e.g. [1]). This is a bit confusing, because the runtime.spawn span also has a field called task.id, but that one refers to the Tokio task ID. The important point here is that our span IDs match (both 1), so this operation is being performed from within the task that it is affecting.

The operation wake_by_ref indicates that the task is being woken using a reference to the waker. This operation doesn't consume the waker - which is important when Tokio Console counts the number of wakers for a given task to make sure that it hasn't lost all its wakers.

With this information, we can now manually ascertain that this is a self-wake operation. We are waking a task while running within that task.

what happens next

Let's change our version of Tokio to the latest (at the time of writing), 1.35.1.

tokio = { version = "=1.35.1", features = ["full", "tracing"] }

And now run exactly the same example. The output is below (truncated in the same way as before).

2024-01-30T16:00:09.484496Z TRACE runtime.spawn[1]{kind=task, task.name=, task.id=18, loc.file="src/main.rs", loc.line=10, loc.col=5} new
2024-01-30T16:00:09.484798Z TRACE runtime.spawn[1]{kind=task, task.name=, task.id=18, loc.file="src/main.rs", loc.line=10, loc.col=5} enter
2024-01-30T16:00:09.484867Z  INFO runtime.spawn[1]{kind=task, task.name=, task.id=18, loc.file="src/main.rs", loc.line=10, loc.col=5} debugging_tokio_instrumentation: fun=true pre-yield
2024-01-30T16:00:09.484930Z TRACE runtime.spawn[1]{kind=task, task.name=, task.id=18, loc.file="src/main.rs", loc.line=10, loc.col=5} tokio::task::waker: op="waker.clone", task.id=1
2024-01-30T16:00:09.484998Z TRACE runtime.spawn[1]{kind=task, task.name=, task.id=18, loc.file="src/main.rs", loc.line=10, loc.col=5} exit
2024-01-30T16:00:09.485073Z TRACE tokio::task::waker: op="waker.wake", task.id=1
2024-01-30T16:00:09.485150Z TRACE runtime.spawn[1]{kind=task, task.name=, task.id=18, loc.file="src/main.rs", loc.line=10, loc.col=5} enter
2024-01-30T16:00:09.485208Z TRACE runtime.spawn[1]{kind=task, task.name=, task.id=18, loc.file="src/main.rs", loc.line=10, loc.col=5} exit
2024-01-30T16:00:09.485261Z TRACE runtime.spawn[1]{kind=task, task.name=, task.id=18, loc.file="src/main.rs", loc.line=10, loc.col=5} enter
2024-01-30T16:00:09.485313Z TRACE runtime.spawn[1]{kind=task, task.name=, task.id=18, loc.file="src/main.rs", loc.line=10, loc.col=5} exit
2024-01-30T16:00:09.485361Z TRACE runtime.spawn[1]{kind=task, task.name=, task.id=18, loc.file="src/main.rs", loc.line=10, loc.col=5} close

It might not be immediately obvious, but that output is one line longer than the previous one. What jumps out is probably that we can now see a wake operation without scrolling to the right. But first, let's check what happens above that.

Directly below our own fun=true pre-yield event line, we see that there is still a tokio::task::waker event and it is still operating on the same task (and the same task that we are currently inside), the one with the task instrumentation ID of 1. However, this isn't a wake operation, instead it has the field value op=waker.clone. Somewhere, the waker for that task is being cloned.

Straight afterwards we see that the span exits - which means that the call to poll on that task has returned. After that, the task is woken. We see that the operation is waker.wake instead of waker.wake_by_ref, which means that the waker is consumed (this makes sense, as it was cloned before). More importantly than all of that though, is that this wake operation isn't inside the runtime.spawn span for that task, in fact it isn't inside any spans at all, runtime.spawn or otherwise.

This confirms what could be observed in Tokio Console, the instrumentation indicates that this is not a self wake!

what changed?

The reason for this change is the PR tokio#5223 (in Tokio itself). This PR changes the behaviour of yield_now() to defer the wake. When a task yields to the runtime in this way, it is immediately ready to be polled again (that's the whole point). Any other task which is ready will get precedence to be polled first (except under some specific conditions involving the LIFO slot). However the scheduler won't necessarily poll the resource drivers, this means that a task that is always ready may starve the resource drivers despite doing its best to be well behaved by yielding regularly to the runtime.

The PR changes the behaviour to defer waking tasks which call yield_now() until after polling the resource drivers, avoiding the starvation issue.

After some discussion on console#512, we decided that it's OK that Tokio Console can't detect this specific case of self wakes, since the PR on Tokio made them much less likely to result in some performance issue - something which may still occur from other futures self waking.

And that's how I managed to use my very basic subscriber crate to answer a question quicker thanks to pretty colours.

should I use ari-subscriber?

Now that we've had a bit of a look at ari-subscriber, the big question is, should anyone be using it?

The answer is no.

Aside from missing a bunch of useful features, ari-subscriber currently does a lot of things "the easy way", which is not very performant. I know how to make it more performant, but I promised myself I'd write this post before doing any more work on the crate.

Unless you too are trying to debug the instrumentation built into Tokio, you're much better off using the fmt::Subscriber from the tracing-subscriber crate.

If you are debugging that instrumentation, please come and say hi! I'd be really interested to hear what you're doing and I might even be able to help.

thanks

Thanks to Luca Palmieri and One for feedback on the post!

rustlab 2023: observing tokio

on Tuesday, 21 November 2023

This year I had the pleasure of speaking at RustLab.

RustLab is a Rust conference in Florence, Italy.

It is co-hosted with GoLab.

(I imagine GoLab was a thing before RustLab)

My talk was titled Observing Tokio.

Title slide of my Observing Tokio talk. The subtitle is "Shining a light into your async runtime". There is the RustLab crab mascot on the right.

In it, I show-cased 3 tools which give insight into the Tokio async runtime.

  1. The metrics inside Tokio

  2. Tokio Console which uses the tracing instrumentation in Tokio

  3. The new task dumps built into Tokio

The talk was recorded.

I'll update this page once the video is available.

In the meantime, I've made the slides available here.

observing-tokio-2023-11-21.pdf

There's not much more to say.

Other than that I really enjoyed the conference.

I met a lot of great people.

And had some fantastic conversations.

starting a virtual rust meet-up

on Tuesday, 31 October 2023

Today we had the first Rust for Lunch meet-up.

I was really happy with the result.

As a bit of a post-mortem, I thought I'd write up the process.

We'll start with the obvious question.

Why create some new Rust meet-up?

why a new meet-up?

I like meet-ups.

Or rather, I like the idea of meet-ups.

Get together with a group of like-minded people.

Hear interesting ideas on your common topic of interest.

Ask questions directly.

Socialise, meet new people, enjoy yourself.

But I've always found it hard to fit them into my schedule.

Bad enough when I lived in Berlin and could often walk there.

(pre-pandemic when we met in person without thinking about it)

Now I live in a small city.

I don't know many people here outside family.

And family makes attending a meet-up more complicated.

Especially in evenings and when they last 2.5 hours.

(and that goes for virtual meet-ups too)

What I wanted was a meet-up that fits in a lunch break.

Unfortunately, such a thing didn't exist.

So I had to create it.

does anyone else want this?

I had a little experience with the format.

At work we have a "Rustacean Meet" every 4 weeks.

It's a work thing, but otherwise very similar to what I wanted.

A one hour slot.

One talk with questions afterwards.

(or two short talks)

We typically have 15-20 people join.

Which is probably half the people who work with Rust in the company.

So that's a good sign.

I also asked some people on Discord.

And got some interest not just in attending, but also in speaking at such a meet-up.

That was enough to take the first step in any serious project.

Buy a domain name.

finding the first speaker

This was the easiest bit.

Conrad had shown interest more than once.

He also seemed to just have a topic ready.

So that was easy.

I hope finding the second speaker will be just as easy.

(if that might be you, get in touch)

software

I went looking for advice on what software to use.

Amongst the people I asked, Google Meet seemed very popular.

I started digging in a bit more.

Then I got a reply on Mastodon that made me think.

@hds I would love to attend, but please don't use a proprietary platform :blobcatcry: What about Jitsi?

Yes, the fact that I'm active on Mastodon and not Twitter comes into play here.

(sorry, not Twitter, X)

Which also made me think whether I want to record these sessions.

At work we record them.

But we're at work anyway.

A poll indicated that some people would be less likely to join if the meet-up was recorded.

And in the meantime, I'd been given another suggestion for software.

@mo8it@fosstodon.org @hds@hachyderm.io I think @senfcall@chaos.social would also be a great fit.

Specifically Senfcall.

It's very privacy based and doesn't offer recording options.

So that was it, I chose privacy over posterity.

publicity

This is an area I was unsure of.

On the one hand, I wanted to get a decent sized audience.

On the other hand, I was wary of having the software overloaded on the first try.

As I'd never used Senfcall for anything, I didn't know how it would handle load.

(although they claim to have run calls with 200 people)

In the end I publicised through 4 channels.

  • A fairly popular semi-public Discord server I'm on

  • Via my Mastodon account @hds@hachyderm.io

  • This Week In Rust's Upcoming Events section

  • In our Rust group at work

As far as I know, no one else publicised the event.

For next time I'd probably try to promote on Reddit r/rust and perhaps on Twitter.

(sorry, sorry, I mean X)

Anywhere else I should consider?

wrap up

How did it go?

As I said at the beginning, I was really happy with the result.

Conrad's talk was entertaining and very well received.

We had 25 people join.

(including me, so perhaps count 24 of them)

And I got some good feedback after the meet-up from people who said they enjoyed it.

There was one person I know of who had technical trouble and couldn't join.

Which is a real shame.

I may need to try some different software before the next one.

(speaking of a next one...)

I'm already planning the next meet-up.

It will be in 4 weeks on 28 November, 2023!

It's a very exciting time!

tracing tokio tasks

on Friday, 29 September 2023

Async programming can be tricky.

Part of the reason for this is that your program is no longer linear.

Things start.

Then they pause.

Something else runs.

It pauses.

The first thing starts again.

The second thing runs.

Then it finishes.

Then the first thing pauses again.

What a mess!

It would be nice if we had a way to analyse what's going on.

Even if it's after the fact.

The good news is you can!

(the not so good news is that the visualisation could be improved)

How is this possible?

Tokio is instrumented!

(I'm talking about Tokio because I'm familiar with it)

(there are many other async runtimes for Rust which may also be instrumented)

(although I don't know of any)

Parts of the Tokio codebase are instrumented with Tracing.

We're going to look specifically at tracing tasks in this post.

Although more of Tokio is also instrumented.

aside: tracing

Tracing is really an ecosystem unto itself.

At the core, Tracing is all about recording spans and events.

An event is something that happens at a specific moment in time.

(traditional logging is all events)

A span represents a period in time.

It doesn't have a single time.

It has two.

The start time and the end time.

(small lie, more on this later)

Let's look at a picture to illustrate the concept.

Time diagram showing an event as an instant in time (at time=1) and a span starting at time=3 and ending at time=6. There is another event inside the span at time=5.

Here we can see two events and a span.

(in a very simplistic visualisation)

The first event occurs at time=1.

(it is cleverly named event 1)

Then we have a span which starts time=3 and ends at time=6.

Within the span we have another event that occurs at time=5.

So we see that events can occur within the context of a span.

Spans can also occur within other spans.

Why do we care?

fields

Traditional logging frameworks generally take two pieces of input for a given log.

The level.

(error, warn, info, debug, trace, and maybe more)

The message.

(some blob of text)

It is then up to whatever aggregates the logs to work out what is what.

(often the whatever is a person staring at their terminal)

This made sense when you log to a byte stream of some sort.

(a file, stdout, etc.)

However we often produce too many logs for humans now.

So we want to optimise for machine readability.

This is where structured logging is useful.

Rather than spitting out any old text and then worrying about format when ingesting it.

We can write logs that can be easily parsed.

To illustrate, let's look at an example of non-structured logs.

I stole this example from a Honeycomb blog post.

Jun 20 09:51:47 cobbler com.apple.xpc.launchd[1] (com.apple.preference.displays.MirrorDisplays): Service only ran for 0 seconds. Pushing respawn out by 10 seconds.

Now let's reimagined this line as a structured log.

(again, courtesy of the good folk at Honeycomb)

{"time":"Jun 20 09:51:47","hostname":"cobbler","process":"com.apple.xpc.launchd","pid":1,"service":"com.apple.preference.displays.MirrorDisplays","action":"respawn","respawn_delay_sec":10,"reason":"service stopped early","service_runtime_sec":0}

This isn't so readable for you.

But it's so much more readable for a machine.

Which brings us back to fields.

Tracing events and spans have fields.

So that the other side of the ecosystem can output nice structured logs.

(the other side generally being something built with tracing-subscriber)

Or even send them to distributed tracing system.

So you can match up what this machine is doing with what some other machines are doing.

And that's the great thing about spans.

A span's children effectively inherit its fields.

So if you set a request id on a span.

(for example)

Then the children spans and events will have access to it.

How that is used is up to the subscriber.

span lifecycle

It's now time to clear up that little lie.

The one about spans having a start and end time.

In Tracing, a span has a whole lifecycle.

It is created.

Then it is entered.

(this is when a span is active)

Then the span exits.

Now the span can enter and exit more times.

Finally the span closes.

Time diagram showing the span lifecycle. The span is created (inactive), later entered and exited twice (so there are 2 active sections). Some time later it is closed.

The default fmt subscriber can give you the total busy and idle time for a span when it closes.

(that's from the tracing-subscriber crate)

(use .with_span_events() to enable this behaviour)

Later you'll see why knowing about span lifecycles is useful.

tracing our code

As I mentioned at the beginning, Tokio is instrumented with Tracing.

It would be nice to see what's going on in there.

So let's write a very small async Rust program.

And look at the instrumentation.

The code is in the web-site repo: tracing-tokio-tasks.

We'll start with Cargo.toml

[package]
name = "tracing-tokio-tasks"
version = "0.1.0"
edition = "2021"

[dependencies]
tokio = { version = "1.32.0", features = ["full"] }
tracing = "0.1.37"
tracing-subscriber = "0.3.17"

Pretty straight forward list of dependencies.

(I'm including the exact version here, which isn't common)

(but hopefully helps anyone following along in the future)

We're looking at tokio, so we'll need that.

We want to use tracing too.

And to actually output our traces, we need the tracing-subscriber crate.

Now here's the code.

#[tokio::main]
async fn main() {
    // we will fill this in later!
    tracing_init();

    tokio::spawn(async {
        tracing::info!("step 1");

        tokio::time::sleep(std::time::Duration::from_millis(100)).await;

        tracing::info!("step 2");
    })
    .await
    .expect("joining task failed");
}

OK, let's dig in.

We're using #[tokio::main] so we're in an async context from the beginning.

We set up Tracing.

(we'll get into exactly how later)

Then we spawn a task.

Before we look at the contents of the task, look down.

We're awaiting the join handle returned by spawn().

(so the task has to end before our program quits)

Now back into the task contents.

We record an event with the message "step 1".

(it's at info level)

Then we async sleep for 100ms.

Then record another event.

This time with the message "step 2".

tracing init

Let's write a first version of our init_tracing() function.

fn tracing_init() {
    use tracing::Level;
    use tracing_subscriber::{filter::FilterFn, fmt::format::FmtSpan, prelude::*};

    let fmt_layer = tracing_subscriber::fmt::layer()
        .pretty()
        .with_span_events(FmtSpan::FULL)
        .with_filter(FilterFn::new(|metadata| {
            metadata.target() == "tracing_tokio"
        }));
    tracing_subscriber::registry().with(fmt_layer).init();
}

Both the tracing and tracing-subscriber crates have extensive documentation.

So I won't go into too much depth.

We're setting up a formatting layer.

(think of a tracing-subscriber layer as a way to get traces out of your program)

(out and into the world!)

The fmt layer in tracing-subscriber will write your traces to the console.

Or to a file, or some other writer.

The fmt layer is really flexible.

We're going to use some of that flexibility.

We want .pretty() output.

This is a multi-line output which is easier to read on a web-site.

(I never use this normally)

The call to .with_span_events() won't do anything just yet.

(so we'll skip it now and discuss later)

Finally we have a .with_filter().

For now we only want the events from our own crate.

(that was simple, right?)

Let's look at the result.

  2023-09-27T13:46:56.852712Z  INFO tracing_tokio: step 1
    at resources/tracing-tokio-tasks/src/main.rs:29

  2023-09-27T13:46:56.962809Z  INFO tracing_tokio: step 2
    at resources/tracing-tokio-tasks/src/main.rs:33

We have logs for each of our two events.

And they're roughly 100ms apart.

(it's actually more like 110ms)

(I wonder where that time went?)

OK, let's start tracing something inside Tokio.

There are a few things we have to do here.

  1. include task spawn spans in our filter

  2. enable the tracing feature in tokio

  3. build with the tokio_unstable cfg flag

The filter is straight forward.

To include the spans, we update the filter.

Our fmt layer creation will now look like the following.

    let fmt_layer = tracing_subscriber::fmt::layer()
        .pretty()
        .with_span_events(FmtSpan::FULL)
        .with_filter(FilterFn::new(|metadata| {
            if metadata.target() == "tracing_tokio" {
                true
            } else if metadata.target() == "tokio::task" && metadata.name() == "runtime.spawn" {
                true
            } else {
                false
            }
        }));

Which is to say.

We also accept traces with the target tokio::task.

But only if the span's name is runtime.spawn.

(and therefore, only if it's a span)

(events don't have names)

Now let's add the tracing feature.

This is as simple as modifying the tokio line in Cargo.toml.

tokio = { version = "1.32", features = ["full", "tracing"] }

Finally, tokio_unstable.

aside: tokio_unstable

Tokio takes semantic versioning seriously.

(like most Rust projects)

Tokio is now past version 1.0.

This means that no breaking changes should be included without going to version 2.0.

That would seriously fragment Rust's async ecosystem.

So it's unlikely to happen.

(soon at any rate)

But there's an escape hatch: tokio_unstable.

Anything behind tokio_unstable is considered fair game to break between minor releases.

This doesn't mean that the code is necessarily less tested.

(although some of it hasn't been as extensively profiled)

But the APIs aren't guaranteed to be stable.

I know of some very intensive workloads that are run with tokio_unstable builds.

So, how do we enable it?

We need to pass --cfg tokio_unstable to rustc.

The easiest way to do this is to add the following to .cargo/config in your crate root.

[build]
rustflags = ["--cfg", "tokio_unstable"]

(needs to be in the workspace root if you're in a workspace)

(otherwise it won't do nuthin')

Back to tracing!

tracing tasks

Each time a task is spawned, a runtime.spawn span is created.

When the task is polled, the span is entered.

When the poll ends, the span is exited again.

This way a runtime.spawn span may be entered multiple times.

When the task is dropped, the span is closed.

(unless the task spawned another task)

(but that's actually incorrect behaviour in the instrumentation)

If you want to understand what polling is, I have a blog series for that.

(check out how I finally understood async/await in Rust)

We'd like to see all these steps of the span lifecycle in our logs.

Which is where span events come in.

By default the fmt layer doesn't output lines for spans.

Just events and the spans they're inside.

Span events are the way to get lines about spans themselves.

Specifically, events for each stage of a span's lifecycle.

(new span, enter, exit, and close)

We enable span events using .with_span_events(FmtSpan::FULL) as seen in the original code.

Now we're ready!

Let's see the output we get now.

  2023-09-28T12:44:27.559210Z TRACE tokio::task: new
    at /Users/stainsby/.cargo/registry/src/index.crates.io-6f17d22bba15001f/tokio-1.32.0/src/util/trace.rs:17
    in tokio::task::runtime.spawn with kind: task, task.name: , task.id: 18, loc.file: "resources/tracing-tokio-tasks/src/main.rs", loc.line: 32, loc.col: 5

  2023-09-28T12:44:27.567314Z TRACE tokio::task: enter
    at /Users/stainsby/.cargo/registry/src/index.crates.io-6f17d22bba15001f/tokio-1.32.0/src/util/trace.rs:17
    in tokio::task::runtime.spawn with kind: task, task.name: , task.id: 18, loc.file: "resources/tracing-tokio-tasks/src/main.rs", loc.line: 32, loc.col: 5

  2023-09-28T12:44:27.574405Z  INFO tracing_tokio: step 1
    at resources/tracing-tokio-tasks/src/main.rs:33
    in tokio::task::runtime.spawn with kind: task, task.name: , task.id: 18, loc.file: "resources/tracing-tokio-tasks/src/main.rs", loc.line: 32, loc.col: 5

  2023-09-28T12:44:27.588111Z TRACE tokio::task: exit
    at /Users/stainsby/.cargo/registry/src/index.crates.io-6f17d22bba15001f/tokio-1.32.0/src/util/trace.rs:17
    in tokio::task::runtime.spawn with kind: task, task.name: , task.id: 18, loc.file: "resources/tracing-tokio-tasks/src/main.rs", loc.line: 32, loc.col: 5

  2023-09-28T12:44:27.683745Z TRACE tokio::task::waker: op: "waker.wake", task.id: 1
    at /Users/stainsby/.cargo/registry/src/index.crates.io-6f17d22bba15001f/tokio-1.32.0/src/runtime/task/waker.rs:83

  2023-09-28T12:44:27.690542Z TRACE tokio::task: enter
    at /Users/stainsby/.cargo/registry/src/index.crates.io-6f17d22bba15001f/tokio-1.32.0/src/util/trace.rs:17
    in tokio::task::runtime.spawn with kind: task, task.name: , task.id: 18, loc.file: "resources/tracing-tokio-tasks/src/main.rs", loc.line: 32, loc.col: 5

  2023-09-28T12:44:27.710193Z  INFO tracing_tokio: step 2
    at resources/tracing-tokio-tasks/src/main.rs:37
    in tokio::task::runtime.spawn with kind: task, task.name: , task.id: 18, loc.file: "resources/tracing-tokio-tasks/src/main.rs", loc.line: 32, loc.col: 5

  2023-09-28T12:44:27.716654Z TRACE tokio::task: exit
    at /Users/stainsby/.cargo/registry/src/index.crates.io-6f17d22bba15001f/tokio-1.32.0/src/util/trace.rs:17
    in tokio::task::runtime.spawn with kind: task, task.name: , task.id: 18, loc.file: "resources/tracing-tokio-tasks/src/main.rs", loc.line: 32, loc.col: 5

  2023-09-28T12:44:27.723284Z TRACE tokio::task: close, time.busy: 46.9ms, time.idle: 117ms
    at /Users/stainsby/.cargo/registry/src/index.crates.io-6f17d22bba15001f/tokio-1.32.0/src/util/trace.rs:17
    in tokio::task::runtime.spawn with kind: task, task.name: , task.id: 18, loc.file: "resources/tracing-tokio-tasks/src/main.rs", loc.line: 32, loc.col: 5

Purple, wow!

(actually magenta)

What is new here is that there is a new span.

It has the target tokio::task.

The span also has a name, runtime.spawn.

(remember, this is how we're filtering for these spans)

Because we enabled span events, we can see the span lifecycle.

The lifecycle state is at the end of the first line of each span event message.

Here is an enter event: TRACE tokio::task: enter

We also have another event with the target tokio::task::waker

The waker events are a bit verbose.

So I've manually removed all the ones that don't have op=waker.wake.

(if you're interested in this, the other op values are waker.clone and waker.drop)

There is something important about this waker.wake event.

It is not inside the task span!

(more on that later)

And of course, our two previous events are still there.

But now they're inside the runtime.spawn span!

This means that from the logs, we could check which task they've come from!

It's the task with Id=18.

We can visualise the spans and events in this trace.

Time diagram showing the spans and events from the previous trace output. The span has two small active sections, one shortly after the span is created and another shortly before it is closed. The two events emitted from within our code are shown within the active parts of the span. There is also an event outside of the span with field op=waker.wake.

First thing to note about this diagram.

It's not to scale!

(that's what the dots in the span mean)

But that doesn't matter, it's illustrative.

(you shouldn't create diagrams like this for production logs)

(it's incredibly laborious)

(but I haven't found a way to automatically create pretty diagrams from tracing output)

What we can see is that we have a span which is relatively long.

And it has two much smaller active sections.

Within each of these sections, we emit an event.

(remember, our cleverly named step 1 and step 2)

This shows us that the task was polled twice.

And we see that the op=waker.wake event isn't in the runtime.spawn span.

This means that the task didn't wake itself.

It was woken by something else.

(which is enough information for now)

calculation the poll time

We can calculate the poll times!

Just look at the difference between the enter and exit events.

So the first poll took around 20ms.

The second poll took around 26ms.

That's interesting, I wonder why the second one took longer?

(I wonder why they're taking so long at all)

(20ms is a really long time!)

calculating the scheduled time

We can also calculate the scheduled time for the second poll.

That's the time between when it was woken and when it was polled.

(I wrote a post about the scheduled time)

(related to some tool, which I won't mention here to not spoil the end)

So, let's calculate the scheduled time.

Let's find the wake time for our task.

We know it's the one with task.id=18.

But we only see a single waker.wake event.

And it has task.id=1.

What is going on here?

It turns out, there's some inconsistency in the Tokio instrumentation.

The meaning of the field task.id has different meanings in different contexts.

When used on runtime.spawn span, it means the tokio::task::Id.

But when used on a waker event, it refers to the tracing::span::Id of a runtime.spawn span.

This is unfortunate and a bit confusing.

More so because the fmt layer doesn't have the option to output the span Id.

It's considered internal.

(and why parsing these traces "manually" isn't recommended)

But anyway, in this case there's only one task, so we know which one it is.

So we calculate the scheduled time as around 6ms.

This is pretty high too.

Especially because our runtime isn't doing anything else.

There's something weird going on here.

the mystery of the delay

Why do we have these large amounts of time between operations?

(yes, 20ms is a large amount of time)

(if you don't believe me, please see Rear Admiral Grace Hopper explaining nanoseconds)

It turns out it's all my fault.

The code in the examples is missing something.

It's not the code that was run to produce the output snippets.

I wanted to show the colourised output that you get in an ANSI terminal.

So I wrapped the pretty FormatEvent implementation with another writer.

This HtmlWriter takes the output and converts ANSI escape codes to HTML.

Fantastic!

Now I have pretty output on my web-site.

But it's very slow.

The fmt layer writes bytes out.

These have to be read into a (UTF-8) &str and then get converted.

Which requires another copy of the data.

Then it's all written out.

My bet is that something in the ansi_to_html crate is slowing things down.

(but only because I tried using str::from_utf8_unchecked and it didn't help)

And that's all the resolution you're going to get today I'm afraid.

Maybe another day we can profile the writer to see what is actually so slow.

When I disable the custom writer, it's a very different story.

There is less than 700 microseconds of busy time for the runtime.spawn span.

Whereas in the example above, there are more than 46 milliseconds of busy time.

don't do this at home

Reading the traces produced by Tokio like this isn't advisable.

Even this trivial example produces a lot of output.

Instead you should use something to analyse this data for you.

And show useful conclusions.

And there's a tool for that.

It's Tokio Console.

I've mentioned it in other posts.

Another option would be to have direct visualisation of the traces.

Unfortunately, I haven't found anything that does this well.

(hence the magnificent hand drawn visualisation used in this post)

If you know of something, I would love to hear from you.

how I finally understood async/await in Rust (part 4)

on Tuesday, 5 September 2023

You've reached the end of my series on understanding async/await in Rust.

(the beginning of the end)

Throughout the last posts we've asked a series of questions.

The answers to those questions helped us understand how async/await works.

We did this by looking at how to "manually" implement futures.

(this is what the async/.await syntax hides from us)

But that syntax is really just sugar on top of implementations of the Future trait.

Everyone likes sugar, so why would we ever not want to use async/await?

(I know that not everyone likes sugar)

(this is where my analogy really falls apart)

This is our final question.

These are the questions we've asked so far.

And why would I?

Let's have a look.

why would I ever want to write a future manually?

Rust's async/await syntax allows us to easily write async code.

But this isn't the best bit.

This syntax allows us to write async code that is easy to read.

It's much easier to follow code written with async/await than the alternatives.

Let's say callbacks.

(like Javascript)

Or something even uglier like delegates from Objective-C.

(I'm going to leave this here for the curious)

But implementing the Future trait in Rust makes those patterns look welcoming!

(enough complaining now)

In reality, async/await allows you to compose futures.

These may be other async functions or blocks.

(which are just futures underneath)

These may be futures written by clever people.

(like the ones who write async runtimes)

But some things can't be done without the implementation details.

Specifically, for some things, you need access to that waker.

why we need a waker

Remember that when a future returns Poll::Pending, that will generally be propagated up to the task.

The future driving the task will return Poll::Pending.

Then the task won't be polled again immediately.

In fact, it won't be polled again at all until it gets woken.

In part 2, we built the YieldNow future.

It returns Poll::Pending, but not before waking the task.

This causes the runtime to schedule the task to be polled again as soon as possible.

This isn't a very interesting future.

(although we learned a lot from it)

An interesting future wouldn't wake the task before returning Poll::Pending.

It would wake the task at some point later when something is ready that wasn't ready immediately.

So let's build an interesting future.

an interesting future

(this is the band formed after pending future split up)

A really interesting future would deal with networking or other OS level things.

But that's beyond the level of this series of posts.

(this is a bit of a lie)

(the truth is, it's beyond me)

So let's build something that isn't too complex.

And ideally has no large dependencies.

(either knowledge or code wise)

We're going to build an async channel!

aside: channels

Channels are a form of message passing.

They are not a concept exclusive to async code or Rust.

(neither is message passing obviously)

Most channels can be thought of as a queue.

Messages go in one end and come out the other.

Channels can be classified by where the messages come from, where they go, and how they're replicated.

How many producers can put messages into the channel?

How many consumers can take messages out of the channel?

How many times does each message get delivered?

The Tokio docs have a nice description of their message passing options.

Let's quickly run through some of those channels.

We can visualize each of them.

This will help us understand what's missing.

oneshot

A oneshot channel support sending a single value from a single producer to a single consumer.

Let's look at a sequence diagram.

Sequence diagram of a oneshot channel. A single messages goes from the producer to the channel and then to the consumer.

This diagram isn't particularly interesting.

But it forms the basis for the next ones.

The important part is that there is only one of each thing.

A single producer.

A single consumer.

And a single message.

(actually Tokio's oneshot channels can be reused, but that's not important here)

Here's the reference to the one in Tokio: tokio::sync::oneshot.

multi-producer single-consumer (mpsc)

That's what MPSC stands for!

(this acronym is often used without any description)

(now you know what it means)

These channels have multiple producers.

But just a single consumer.

And many messages can be sent across them.

Quick aside-aside.

Often we distinguish bounded from unbounded channels.

Bounded channels have a fixed size buffer.

Unbounded channels have an unlimited buffer.

(so they will keep filling up until the system runs out of memory)

We will gloss over this when discussing channels on a high level.

Let's look at how it works.

Sequence diagram of a multi-producer single-consumer (mpsc) channel. Two producers send messages to the channel, the single consumer receives those messages in the order they were received by the channel.

First big difference is that there are multiple producers.

(no big surprises there)

They each send some some messages to the channel.

The channel then delivers those messages to the consumer.

They are delivered in order.

(we usually say they are delivered in the order they were sent)

(it's really the order in which the channel received the messages)

(this is mostly the same thing)

The one in Tokio is tokio::sync::mpsc.

broadcast

After multi-producer single consumer channels comes...

Multi-producer multi-consumer (MPMC) channels!

(sort of)

A broadcast channel is always a multi-consumer channel.

But with something special.

All consumers receive all values.

Some broadcast channels may only allow a single producer (SPMC).

(single-producer multi-consumer)

Others allow multiple producers (MPMC).

(multi-producer multi-consumer)

But normally we reserve MPMC for a different type of channel.

For now, let's look at the sequence diagram.

Sequence diagram of a broadcast channel. One producer sends messages to the channel, the two consumer receive each of those messages in the order they were received by the channel.

Both of the receivers get the same sequence of messages.

That's the key here.

Tokio also has one: tokio::sync::broadcast.

multi-producer multi-consumer (mpmc)

Another acronym that we now understand!

Multi-producer multi-consumer.

As we just saw, a broadcast channel can be a sort of MPMC channel.

The difference is that in this channel, each message will only be received by a single consumer.

This is the sort of channel you would use to distribute work a finite number of tasks.

The sequence diagram shows the difference.

Sequence diagram of a mpmc channel. Two producers send messages to the channel, each message is received by only a single consumer. The messages are received by the consumers in the order that they were received by the channel.

Like all the channels we've seen, this channel is ordered.

The consumers receive messages in the same order they were sent.

But there is no concept of fairness amongst consumers.

The first consumer to try to receive a message gets the next message.

(we could also say that there is no load balancing)

Now, where's that link to the implementation in Tokio?

There isn't one!

Tokio doesn't have an implementation of an MPMC channel.

So let's build one!

But first, some truth telling.

aside: async-channel

There are implementations of MPMC channels available.

The async-channel crate provides one.

It's part of the smol-rs project.

Smol is another async runtime for Rust.

It's more modular than Tokio.

As a result, some parts of it can be dropped into a Tokio runtime and just work.

But we can still learn something from building our own.

So let's do that!

our own mpmc channel

We're going to write our own multi-producer multi-consumer channel.

And it's going to be simple.

(you know I'm all about simple)

Here's the complete code: understanding_async_await::mpmc.

In case you prefer having it from the beginning.

Let's begin with the API.

We'll base it on the std library and Tokio channel APIs.

channel API

Here's the signature for our channel() function.

(with rustdocs, you always include rustdocs, rigth?)

/// Creates a new asynchronous bounded multi-producer multi-consumer channel,
/// returning the sender/receiver halves.
///
/// The channel will buffer messages up to the defined capacity. Once the
/// buffer is full, attempts to send new messages will wait until a message is
/// received from the channel. When the channel is empty, attempts to receive
/// new messages will wait until a message is sent to the channel.
///
/// If all receivers or all senders have disconnected, the channel will be
/// closed. Subsequent attempts to send a message will return a
/// [`ChannelClosedError`]. Subsequent attempts to receive a message will drain
/// the channel and once it is empty, will also return a [`ChannelClosedError`].
pub fn channel(capacity: usize) -> (Sender, Receiver)

OK, so we have much more docs than function signature.

Let's break it down.

The function returns sender and receiver halves.

This is standard Rust practice for constructing a channel.

The two halves can be passed around as needed.

Independent of one another.

(we'll look at the halves shortly)

In the second paragraph, we specify that our channel will buffer messages.

So the function requires the capacity.

This means capacity messages can be sent without any being received.

Then what?

Then the channel is full.

And the senders will wait until some message is received.

(wait asynchronously of course)

On the other side, the channel might be empty.

Then the receivers will wait until some message is sent.

(yes, yes, wait asynchronously)

Finally we have a bit about closing the channel.

There are two ways the channel could get closed.

If all the receivers disconnect from the channel.

(this means all the receivers are dropped)

This means that no messages will be received.

So there's no point in sending any more.

(queue the song Unsent Letter by MGF)

So we'll alert the senders by returning an error next time a send is attempted.

The other way is if all the senders disconnect from the channel.

In this case, no new messages will be sent.

But there may be messages in the channel already.

So we'll let the receivers drain the channel.

(retrieving any messages in there)

But once the channel is empty, new receive attempts would block forever.

(I don't have a song for this one)

(really should have used Unsent Letter here instead)

Instead, trying to receive from a channel that is empty and closed will return an error.

That seems pretty clear.

Let's look at the sender and receiver halves.

One more thing.

This channel only sends Strings.

(I know this is boring)

(but let's focus on async stuff, not generics stuff)

channel halves

(I really wanted to call this section "you complete me")

First let's look at the sender.

/// The sending-half of the [`mpmc::channel`] type.
///
/// Messages can be sent through the channel with [`send`].
///
/// This half can be cloned to send from multiple tasks. Dropping all senders
/// will cause the channel to be closed.
///
/// [`mpmc::channel`]: fn@super::mpmc::channel
/// [`send`]: fn@Self::send
pub struct Sender

Nothing much new on the struct itself.

We can clone it.

(but we don't derive Clone, you'll see why later)

It can be used to send messages.

Let's have a look at that method.

impl Sender {
    /// Sends a value, waiting until there is capacity.
    ///
    /// A successful send occurs when there is at least one [`Receiver`] still
    /// connected to the channel. An `Err` result means that the value will
    /// never be received, however an `Ok` result doesn't guarantee that the
    /// value will be received as all receivers may disconnect immediately
    /// after this method returns `Ok`.
    pub async fn send(&self, value: String) -> Result<(), ChannelClosedError>
}

Remember, we're just sending strings today.

(making this channel generic is left as an exercise for the reader)

Our public API is an async function that takes the value to be sent.

It returns a result.

The result can either be Ok with the unit type ().

Or it could be our error.

There is only one possible error, that the channel is closed.

Now let's look at the receiver.

/// The receiving-half of the [`mpmc::channel`] type.
///
/// Messages can be received from the channel with [`recv`].
///
/// This half can be cloned to receive from multiple tasks. Each message will
/// only be received by a single receiver. Dropping all receivers will cause
/// the channel to be closed.
///
/// [`mpmc::channel`]: fn@super::mpmc::channel
/// [`recv`]: fn@Self::recv
pub struct Receiver

Once again, what we expect.

And again, we claim to be able to clone the receiver.

But we don't derive Clone.

We also only implement a single public (async) function on Receiver.

impl Receiver {
    /// Receives a value, waiting until one is available.
    ///
    /// Once the channel is closed (by dropping all senders), this method will
    /// continue to return the remaining values stored in the channel buffer.
    /// Once the channel is empty, this method will return
    /// [`ChannelClosedError`].
    pub async fn recv(&self) -> Result<String, ChannelClosedError>
}

Upon success, recv() will return a String.

The only error it can return is ChannelClosedError.

And this is only returned if the channel is empty.

Now we know the API we'd like to implement.

Let's look at an example sequence diagram of how it would be used.

We'll just use a single produce and single consumer to understand the async/await part better.

Sequence diagram of an mpmc channel. A main task creates a channel and then sends the receiver to a task to loop over receiving. the sender is sent to a different task to send 2 values.

(code that implements this sequence can be found on GitHub: channel_halves.rs)

Our main task calls channel(1) and gets the sender and receiver back.

This is a channel with a capacity of one.

(not very big)

The receiver is sent to its own task to receive in a loop.

We now imagine that it tries once.

But the call to recv().await has to wait because the channel is empty.

Now the sender gets sent to its own task to send two values.

The first is sent.

Then it attempts to send the second value.

(we're picking our own concurrent interleaving here)

(it makes the story more interesting)

The second value can't be sent as the channel is full.

So the call to send().await waits.

Our receiver now receives a value.

As the channel now has capacity, the waiting call to send().await returns.

The sending task now completes.

This leaves our receiver.

It receives the second value.

(all good)

Then it tries to receive again.

This time it gets an Err(ChannelClosedError) back.

Since the sender was dropped, the channel is closed.

And now it's empty as well.

So our receiving loop task also completes.

With this, we have a basis for understanding how our API should work.

Time to look at implementing this async functionality.

This will involve implementing these two async functions.

Sender::send() and Receiver::recv().

To do this we will need to implement futures manually.

(that is the whole point of this series in a way)

(understanding async/await by implementing the bits under it)

So let's look at each of these async functions and the futures underneath them in turn.

inner channel

One thing, before we start implementing futures.

The senders and receivers will all share the channel.

We're going to do that the easy way.

A private struct wrapped in Arc and Mutex.

We learnt about mutexes in part 3.

(we also learnt about some things we shouldn't do with them)

(so we won't do that stuff)

Using a Mutex in this way isn't generally very efficient.

It will definitely not perform well under high load.

But it will serve to let us write our send and receive futures.

And we'll know that we won't cause any data corruption or data races.

So we'll create a Channel struct.

This won't be public.

We'll look at its implementation later.

send future

We're going to start with implementing Sender::send().

Let's look at a sequence diagram of our three different outcomes.

As we prepare to implement Future, we'll expand upon this diagram.

Sequence diagram of the use of the async function Sender::send. It covers three use cases: channel has capacity, channel is closed, and channel is full.

This diagram is on an async/await level.

The three outcomes represent three states that the channel can be in.

State: channel has capacity.

In this case, the async function returns Ok straight away.

(an async function returning straight away isn't the same as any other function returning straight away)

(it could still yield to the runtime in the meantime)

State: channel is closed.

This is a terminal state for the inner channel.

(that means it's the last state, there are no more states after it)

The async function will immediately return the channel closed error.

(same caveat on using "immediately" with "async")

State: channel is full.

In this case, the async function will wait, not return anything.

(we know there is probably a Poll::Pending needed here)

(but let's not get ahead of ourselves)

At some point, capacity will be freed

(we hope)

This would happen when a receiver receives a message.

Then the async function will return Ok as in the first case.

(since we've essentially moved to the first state)

Let's go on to implement our async function.

We won't go into the details of constructing the Sender struct.

For now, it's enough to know that Sender has a private field giving it access to the inner channel.

pub struct Sender {
    inner: Arc<Mutex<Channel>>,
}

To implement that public async function, we're going to need a Future.

We'll call our future Send.

(not very imaginative, which is probably a good thing)

(imaginative names make less sense to others)

First, here's that implementation of Sender::send().

pub async fn send(&self, value: String) -> Result<(), ChannelClosedError> {
    Send {
        value,
        inner: self.inner.clone(),
    }
    .await
}

Pretty simple, right?

We construct our Send future.

And then await it.

To be clear about the types, here is the struct definition for Send.

struct Send {
    value: String,
    inner: Arc<Mutex<Channel>>,
}

Our Send future has just one job

Send a value when the channel has capacity.

We don't even need state for this.

We will instead depend on the state of the channel.

(and we'll trust our async runtime to not poll us after we've returned Poll::Ready)

We do need the value itself.

And the Send future may outlive the Sender.

(although this isn't ideal)

So we'll take our own reference to the inner channel.

Before we look at the implementation, let's expand our sequence diagram.

We're diving through the async/await syntax and into future land.

Sequence diagram of the use of the future Send. It covers three use cases: channel has capacity, channel is closed, and channel is full.

The creation of the Send future is outside of the states.

This is because it is always the same.

As you can see, we've already created part of the API for our inner channel.

This is based purely on what we know we need.

It has a (synchronous) send() function which returns a result.

Either Ok(()) or one of 2 errors depending on whether the channel is closed or full.

The first two states are fairly straight forward.

(channel has capacity and channel is closed)

So let's look at channel is full.

In this case, Channel::send() will return an error stating that the channel is full.

Our Send future will return Poll::Pending.

But first...

We need a way to register our waker with the channel.

Then we'll expect to get woken when there is free capacity.

For this, the channel has another method, Channel::register_sender_waker().

The diagram cheats a little bit.

We know that the channel won't wake our task directly.

We'll also skip over the channel implementation.

It's enough that we have a requirement.

When we register a sender waker, the channel must wake it when there is capacity.

Of course, there may be multiple senders and they may have all registered wakers.

So we can't expect to be woken for the next free capacity.

But that's an inner channel implementation detail.

Now let's dive into the Future implementation.

impl Future for Send {
    type Output = Result<(), ChannelClosedError>;

    fn poll(self: std::pin::Pin<&mut Self>, cx: &mut std::task::Context<'_>) -> Poll<Self::Output> {
        let Ok(mut guard) = self.inner.lock() else {
            panic!("MPMC Channel has become corrupted.");
        };

        match guard.send(self.value.clone()) {
            Ok(_) => Poll::Ready(Ok(())),
            Err(ChannelSendError::Closed) => Poll::Ready(Err(ChannelClosedError {})),
            Err(ChannelSendError::Full) => {
                guard.register_sender_waker(cx.waker().clone());
                Poll::Pending
            }
        }
    }
}

The Output will be the same value that Sender::send() returns.

To begin with, we'll try to lock the mutex wrapping our inner channel.

If this returns an error, the inner channel is corrupted.

(actually, the mutex is poisoned)

(we looked a little bit at poisoning in how rust does mutexes from part 3)

In any event, we'll panic and be done with it.

Then we'll call send() on our inner channel.

We've already gone over the details of what happens here in the sequence diagram.

One implementation detail is that we clone the value to send to the inner channel.

This could be avoided.

But the implementation would be much more complex.

(it's because if the channel is full, we need our value back again)

So we'll leave it like this for now.

Tokio's channels use semaphore permits to correctly implement this without cloning.

That's the implementation of our Send future!

In the end it wasn't so scary.

We already knew what we needed to do.

Now we can look at the receive future.

Later we'll go over the implementation of the inner channel.

(that's mostly for completeness sake)

(and also because we want to cover actually using the waker that we "registered")

recv future

We've just seen the implementation for our async send function.

And the future that underpins it.

Now let's look at the async function Receiver::recv().

As you can probably imagine, this function is analogous to Sender::send() in many ways.

We'll cover the receive function in a similar amount of detail though.

Just to make sure that it is understandable.

First let's look at the sequence diagram up to the async function.

Sequence diagram of the use of the async function Receiver::recv. It covers three use cases: channel has messages, channel is closed and empty, and channel is empty (not closed).

Just like the send one, this diagram is on an async/await level.

We also have three states.

But they are ever so slightly different.

State: channel has messages.

In this case, the recv async function returns Ok(msg).

Here msg is the first message in the channel.

It does this async-immediately.

(that's returning immediately in an async sense, but really could be doing anything in the meantime)

State: channel is closed and empty.

This state is similar to the closed channel state for the send function.

But with an additional condition.

The channel is closed and there are no more messages.

If there are remaining messages in the channel, the receivers will still get them.

Even if the channel is closed.

However, if the channel is closed and empty, and error is returned.

This is the same error that the sender returns if the channel is closed.

State: channel is empty (not closed).

For receiving, the "interesting" state is when the channel is empty.

So no message can be received.

The async function will wait.

It won't return.

(again, we can smell a Poll::Pending around here somewhere)

(but we can't see it yet)

At some point, a new message will be sent to the channel.

Then our async function will return Ok(msg).

The same as in state "channel has messages".

Now it's time to implement.

Here's the async function Receiver::recv().

pub async fn recv(&self) -> Result<String, ChannelClosedError> {
    Recv {
        inner: self.inner.clone(),
    }
    .await
}

We see that we need a new future.

Clearly we'll call it Recv.

Note that Receiver::recv() doesn't take any arguments.

(just &self, a reference to itself)

So the Recv future only needs the reference to the internal channel.

For completeness, here's the structure definition.

pub struct Receiver {
    inner: Arc<Mutex<Channel>>,
}

When we implemented Future for Send we didn't hold any state.

We made use of the state of the inner channel.

As we implement Future for Recv we will do the same.

But before we write any code, let's understand what we require.

Here's the sequence diagram showing the different states we have to consider.

(after pulling back the curtains to see the future underneath)

(this is another good band name)

(or a Culture ship name)

The same as the Send diagram, the creation of Recv happens outside of the state options.

As it is always the same.

Sequence diagram of the use of the future Recv. It covers three use cases: channel has messages, channel is closed and empty, and channel is empty (not closed).

We've further extended the necessary inner channel API.

We also need a Channel::recv() function.

Just like Channel::send() it can return 3 values.

If there is a message to receive, it returns Ok(msg).

And our future can return Poll::Ready with that msg.

If the channel is closed and empty, it returns Err(ChannelRecvError::Closed).

Then our future can also return Poll::Ready straight away, but this time with the closed error.

(that's Err(ChannelClosedError), same as for sending)

The interesting state is now when the channel is empty.

(empty but not closed of course)

Then we return Poll::Pending.

But first we need to register our waker.

A receiver waker needs to be woken on a different condition than a sender waker.

So we need a different API to register it.

(but we already gave this away when we called the other method Channel::register_sender_waker())

That's why we need Channel::register_receiver_waker().

We will expect a receiver waker to be woken when a new message enters the channel.

In this sequence diagram, we show the inner channel waking the consumer task.

But we know this goes through the runtime.

Even though we know everything already, let's look at the Future implementation.

impl Future for Recv {
    type Output = Result<String, ChannelClosedError>;

    fn poll(self: std::pin::Pin<&mut Self>, cx: &mut std::task::Context<'_>) -> Poll<Self::Output> {
        let Ok(mut guard) = self.inner.lock() else {
            panic!("MPMC Channel has become corrupted.");
        };

        match guard.recv() {
            Ok(value) => Poll::Ready(Ok(value)),
            Err(ChannelRecvError::Closed) => Poll::Ready(Err(ChannelClosedError {})),
            Err(ChannelRecvError::Empty) => {
                guard.register_receiver_waker(cx.waker().clone());
                Poll::Pending
            }
        }
    }
}

As with Send, the Output is the same as the return type of Receiver::recv().

We lock the mutex around the inner channel.

(and perform the same check for a poisoned mutex)

(our thread is like a food taster)

(if the mutex is poisoned, it dies to warn everyone else)

(except this may cause the whole program crash)

(which is like everyone dying)

Then we call Channel::recv().

We've gone through the three options already.

So we won't repeat ourselves.

That's it.

We've just written the second and final future we need for our async mpmc channel!

Of course, we would like to look at the inner channel in a bit more detail.

So let's do that now!

inner channel implementation

We've already defined four methods that our inner channel needs.

(I keep calling it the inner channel, but there is no outer channel struct)

(so the struct is just called Channel)

impl Channel {
    fn send(&mut self, value: String) -> Result<(), ChannelSendError>
    fn recv(&mut self) -> Result<String, ChannelRecvError>
    fn register_sender_waker(&mut self, waker: Waker)
    fn register_receiver_waker(&mut self, waker: Waker)
}

First we have sync versions of send() and recv().

They each have their own error type.

(we've seen them both already while implementing the Send and Recv futures)

And two methods to register wakers.

One for sender wakers.

And one for receiver wakers.

Now we have enough information to fill in the Channel struct.

/// The inner mpmc channel implementation.
///
/// This is a sync object. All methods return immediately.
struct Channel {
    /// The message buffer
    buffer: VecDeque<String>,
    /// The capacity of the channel, this many messages can be buffered before
    /// sending will error.
    capacity: usize,
    /// Indicates when the channel has been closed.
    closed: bool,

    /// The number of connected `Sender`s.
    senders: usize,
    /// The number of active `Receiver`s.
    receivers: usize,

    /// A queue of wakers for senders awaiting free capacity in the channel.
    sender_wakers: VecDeque<Waker>,
    /// A queue of wakers for receivers awaiting a new message in the channel.
    receiver_wakers: VecDeque<Waker>,
}

I've included rustdoc comments explaining each field.

But let's go through the groups.

We use a VecDeque as the message buffer.

We keep the total capacity of the channel separately.

(we could use the capacity on the VecDeque for this, but that seems like it might go wrong)

(basically because we don't control how that capacity value works)

We also have a boolean to track when the channel is closed.

The second group is a pair of counters.

We keep track of the number of senders and receivers.

(actually, we're going to expect the senders and receivers to keep track of themselves)

(but the counters need to be on the channel)

Then the last group are the queues of sender and receiver wakers.

These will be used to wake a sender waiting for capacity.

And wake a receiver waiting for a message.

Let's go backwards in adding our implementations.

The two register methods are easy.

impl Channel {
    /// Registers a waker to be woken when capacity is available.
    ///
    /// Senders are woken in FIFO order.
    fn register_sender_waker(&mut self, waker: Waker) {
        self.sender_wakers.push_back(waker);
    }

    /// Registers a waker to be woken when a message is available.
    ///
    /// Receivers are woken in FIFO order.
    fn register_receiver_waker(&mut self, waker: Waker) {
        self.receiver_wakers.push_back(waker);
    }}

Each method pushes the waker to the back of the queue.

That's all we need right now.

Now let's look at the implementation for the Channel::send() method.

impl Channel {
    /// Sends a message across the channel.
    ///
    /// If the message can be sent, the next receiver waker in the queue (if
    /// any) will be woken as there is now an additional message which can be
    /// received.
    ///
    /// An error will be returned if the channel is full or closed.
    fn send(&mut self, value: String) -> Result<(), ChannelSendError> {
        if self.closed {
            return Err(ChannelSendError::Closed);
        }

        if self.buffer.len() < self.capacity {
            self.buffer.push_back(value);
            self.wake_next_receiver();
            Ok(())
        } else {
            Err(ChannelSendError::Full)
        }
    }
}

We check check if the channel is closed.

That would mean returning the Closed error.

With that our of the way, we check if there is capacity.

If there is, we push the value onto the back of the buffer.

Then we wake the next receiver.

(more on this in a moment)

And return OK(()), we're finished.

If there isn't capacity, we return the Full error.

(now back to waking the next receiver)

Here's the implementation.

impl Channel {
    /// Wakes the receiver at the front of the queue.
    ///
    /// If no receiver wakers are registered, this method does nothing.
    fn wake_next_receiver(&mut self) {
        if let Some(waker) = self.receiver_wakers.pop_front() {
            waker.wake();
        }
    }
}

As you can see, we pop the next receiver waker.

If there is one, we wake it.

If there isn't one, we do nothing.

There being no receiver waker is the most common case.

(unless the channel is permanently full)

(which is not an ideal situation, but could happen)

However, we may as well try to pop the next value from the queue and use that to check if there is one.

Note that all these methods are synchronous.

And we assume that whoever is calling methods on Channel has locked its mutex.

("whoever" being the Sender, Receiver or their futures Send and Recv)

So we don't need to worry about access from multiple threads.

(again, this is multi-threaded cheating, but it allows us to focus on the Future impl)

The implementation for Channel::recv() is similarly straight forward.

impl Channel {
    /// Receives a message from the channel.
    ///
    /// If a message can be received, then the next sender waker in the queue
    /// (if any) will be woken as there is now additional free capacity to send
    /// another message.
    ///
    /// An error will be returned if the channel is empty. The error will
    /// depend on whether the channel is also closed.
    fn recv(&mut self) -> Result<String, ChannelRecvError> {
        match self.buffer.pop_front() {
            Some(value) => {
                self.wake_next_sender();
                Ok(value)
            }
            None => {
                if !self.closed {
                    Err(ChannelRecvError::Empty)
                } else {
                    Err(ChannelRecvError::Closed)
                }
            }
        }
    }
}

Here we attempt to pop a result from the buffer.

(we don't care if the channel is closed if there are still messages available)

if there is a value, we wake the next sender.

(there is now one additional capacity in the buffer)

Then return the value.

If there is no value, the buffer must be empty.

If the channel isn't closed, then we return the Empty error.

Otherwise, the channel is closed and we return the Closed error.

The sender waking method is basically the same as the receiver one.

impl Channel {
    /// Wakes the sender at the front of the queue.
    ///
    /// If no sender wakers are registered, this method does nothing.
    fn wake_next_sender(&mut self) {
        if let Some(waker) = self.sender_wakers.pop_front() {
            waker.wake();
        }
    }
}

That's the end of the implementation of the inner channel.

(almost the end)

(there's a little bit more)

What we haven't seen is how we determine that the channel is closed.

And together with that, how we determine when the channel should still be open.

We already saw on the Channel struct that we have counters for senders and receivers.

Now we need to implement the incrementing and decrementing of those counters.

counting

There are a few different places that the incrementing / decrementing logic could be placed.

For this code, I placed the incrementing in the new() method.

And the decrementing in the Drop implementation.

Let's look at the lifecycle of our channel's senders in a sequence diagram.

Note, at this point, we're only going to look at Sender.

The Receiver implementation is identical, so it makes no sense to cover it.

Sequence diagram of the lifecycle of Sender objects. It covers 4 stages. Initial channel creation, cloning a sender, dropping a sender, and dropping the last sender. Where the final stage also closes the channel.

During initial channel creation, a Sender is created with an inner channel.

The Sender is responsible for calling Channel::inc_senders().

Now the inner channel will have a sender count of 1.

The next case is sender cloning.

(this is important to have multiple producers)

(our receivers can also be cloned in the same way, giving us multiple consumers)

(that's mpmc!)

Here we rely on Sender::new() to increment the sender count in the inner channel.

(this is why it made sense to put that logic in new())

The inner channel now has a sender count of 2.

Then we get onto the drop logic.

In Rust, the Drop trait gives structs a sort of destructor.

We don't have to call drop() explicitly.

It will be called automatically when an object goes out of scope.

So we'll use this to decrement the counter.

Imagine our cloned sender gets dropped.

The counter gets decremented.

So the inner channel's sender count is 1 again.

Nothing more is done.

Finally, the original sender is also dropped.

This time the inner channel's sender count goes to 0.

It calls Channel::close() on itself.

Inside close(), the channel will also wake any still registered wakers.

We would expect these to only be receiver wakers.

But a Send future can be sent to another task before being polled.

So it's possible that we have a sender waker registered for a Send future whose Sender has been dropped.

It's just safer to wake everything left.

This will avoid tasks that get stuck because they've lost their waker.

Let's jump into the implementation.

For the first and second phases.

(new channel and sender cloning)

We will need the implementation of new and the Clone trait.

Here they are.

impl Sender {
    fn new(inner: Arc<Mutex<Channel>>) -> Self {
        {
            match inner.lock() {
                Ok(mut guard) => guard.inc_senders(),
                Err(_) => panic!("MPMC Channel has become corrupted."),
            }
        }
        Self { inner }
    }
}

Note that new() needs to lock the mutex around the channel to get access to it.

It could be poisoned.

Which would cause us to panic.

There's a reason we don't use expect on the result of lock().

We don't want to leak our implementation in the error message.

(by implementation we mean the fact that we're using a mutex)

So it's better to match the result.

If the mutex hasn't been poisoned, we'll call Channel::inc_senders().

Clone will just pass the Arc-Mutex to new.

This is also why we can't derive Clone.

Because we need to call Sender::new().

impl Clone for Sender {
    fn clone(&self) -> Self {
        Self::new(self.inner.clone())
    }
}

To implement Drop we will also need to lock the mutex.

impl Drop for Sender {
    fn drop(&mut self) {
        match self.inner.lock() {
            Ok(mut guard) => guard.dec_senders(),
            Err(_) => panic!("MPMC Channel has become corrupted."),
        }
    }
}

As long as the mutex hasn't been poisoned, we call Channel::dec_senders().

The remaining logic is in the last few methods on Channel.

impl Channel {
    /// Increment the sender count.
    fn inc_senders(&mut self) {
        self.senders += 1;
    }

    /// Decrement the sender count.
    ///
    /// If the count reaches zero, close the channel.
    fn dec_senders(&mut self) {
        self.senders -= 1;
        if self.senders == 0 {
            self.close();
        }
    }

    /// Close the channel.
    ///
    /// All sender and receiver wakers which have been registered, but not yet
    /// woken will get woken now.
    fn close(&mut self) {
        self.closed = true;

        while let Some(waker) = self.sender_wakers.pop_front() {
            waker.wake();
        }
        while let Some(waker) = self.receiver_wakers.pop_front() {
            waker.wake();
        }
    }
}

The method inc_senders() does nothing more than increment the counter.

Whereas dec_senders() also checks for zero.

If the counter reaches zero, it closes the channel.

Finally, the close() method sets our boolean flag to true.

Then it flushes all the wakers.

Which means it pops them off their respective queues one by one.

And wakes them.

This will avoid stuck tasks.

It also avoids a nasty reference loop.

Wait.

A what?

a nasty reference loop

Our implementation contains a nasty reference loop.

This would result in a memory leak if not handled properly.

(but don't stress, it is being handled properly)

Let's explain.

Until a task completes, it is owned by the runtime.

And our task owns the future it is currently polling.

This would be the Send future for a producer task.

And our Send future has an Arc of the inner channel.

(via the mutex)

This would prevent the Arc's counter from ever going to zero.

So the wakers would never be dropped.

Which is unfortunate.

As not even Tokio Console's lost waker lint would catch that.

(since the waker count is still 1)

(console can't know that it will never be used again)

Here's a diagram of the loop.

Diagram showing a reference loop centring on the Send future in the inner channel.

But since we wake all the wakers upon closing the channel.

And the channel closing isn't dependent on the number of futures that may reference the inner channel.

We break the loop and everything can be freed.

As mentioned above, the receiver implementation is practically identical.

So we won't cover it here.

You can find it in the complete code though: understanding_async_await::mpmc.

There is also a small example with multiple producers and consumers: channel.

In fact, you can check out my blog repo.

And in there you can run lots of code from this series: understanding-async-await.

the end

That's the end of our async multi-producer multi-consumer channel implementation.

It's also the end of this series of blog posts.

The one on "How I finally understood async/await in Rust".

(you know you're reading a series, right?)

(no?)

(lucky you, you can start from the beginning)

During this series, we asked four questions.

Here is the abridged version.

(spoiler alert!)

Why doesn’t my task do anything if I don’t await it?

(because it returns a state machine in its initial state)

How does a pending future get woken?

(there's a thing called a waker that wakes the owning task)

Why shouldn’t I hold a mutex guard across an await point?

(because we're actually returning from a function at every await point)

Why would I ever want to write a future manually?

(because without async primitives written as "manual futures" you can't actually do anything async)

Of course the real reason for the last question was so I had an excuse to write one.

Now I've got this series out of the way.

(and the desire to write a series of blog posts out of my system)

I plan to go back to writing smaller posts on whatever I happen to be doing at the time.

thanks

Thanks to everyone for reading!

A few people wrote to me to say how much they were enjoying the series.

(and/or learning something from it)

A huge thank you to these very kind people!

That was very motivating and always made my day.

(let's be honest, it made my week, perhaps even the month)

how I finally understood async/await in Rust (part 3)

on Monday, 31 July 2023

This is a series on how I understood async/await in Rust.

This is part 3.

Here's the full list:

Previously we looked at what happens when a future gets awaited.

We also dove into how a pending future gets awoken.

Now we're going back to that await topic.

We're going to look into why some things shouldn't be held across await points.

Often the first thing a new author of async code needs to do is share state.

Typically, shared state is protected by a mutex.

(or some mutex variant, like a read-write lock)

So today we'll focus on mutex guards.

why shouldn't I hold a mutex guard across an await point?

Let's assume we want to share state in async code.

This is often not a good idea.

(actually, it's often not even necessary)

(but that is a story for another day)

But sometimes it is necessary.

And it's worth looking at anyway.

Because what we're interested in here is understanding async/await.

Not necessarily doing it right.

(yet)

aside: mutexes and mutex guards in rust

We're going to be talking about mutexes a lot.

So it's probably worth going over the basics quickly.

To make sure we're on the same page.

Mutex is short for "Mutual Exclusion".

It's a concurrent programming primitive.

It ensures that only one part of the program is doing some specific thing at a given time.

Usually this is accessing an object which is shared across threads.

(if you don't have multiple threads, then you don't need this sort of protection)

A traditional mutex has two methods.

(traditional here means different to Rust)

Lock.

Unlock.

The code locks the mutex, does something, then unlocks the mutex.

If some other part of the program already holds the mutex, then your code blocks on the lock method.

We could imagine this flow in Rust by inventing our own types.

// These are NOT real Rust types, especially `MyMutex`
fn exclusive_access(mutex: &MyMutex, protected: &MyObject) {
    // Blocks until a lock can be obtained
    mutex.lock();

    // This "something" is what is protected by the mutex.
    protected.do_something();

    // Once unlocked, other threads can lock the mutex. Don't forget this bit!
    mutex.unlock();
}

The problem here is that MyObject is only protected by convention.

We have to trust that everywhere that MyObject is accessed, the same mutex is locked.

(if you lock a different mutex it really doesn't help at all)

And you might forgot to unlock the mutex when you're finished.

That doesn't seem likely in this toy example.

But imagine that we use the ? operator to return early from do_something() if it returns an error.

Oops!

Now we can't ever lock the mutex again.

how rust does mutexes

(by the way, my English speaking brain keeps wanting the plural to be mutices)

Instead, Rust sticks the mutex and the object it protects together.

This is std::sync::Mutex.

The protected object is effectively inside the mutex.

When you lock the mutex you get a MutexGuard.

(now we're getting to the mutex guard)

And you can access your protected object through the guard by dereferencing it.

When the guard goes out of scope, the mutex is unlocked automatically.

This behaviour is called RAII.

Which stands for "Resource Acquisition Is Initialization".

For our purposes, it means that we can only get a MutexGuard if we can acquire a lock.

(the guard is the resource or 'R' in RAII)

And that the lock is tied to the lifetime of the guard returned.

Once the guard gets dropped, the lock is released.

And therefore, as long as the object is not leaked, the mutex will never stay locked forever.

Wow, that was a lot to take in.

Let's look at our previous example oxidised.

(oxidised as in using Rust standard library and conventions)

// This is now the std library mutex
fn exclusive_access(mutex: &std::sync::Mutex<MyObject>) {
    // Blocks until a lock can be obtained (same as before)
    let guard = mutex
        .lock()
        .expect("the mutex is poisoned, program cannot continue");

    // The guard gets automatically dereferenced so we can call
    // `MyObject`'s methods on it directly.
    guard.do_something();

    // That's it, once the guard goes out of scope, the lock is released.
}

See how we can't accidentally access MyObject without locking the mutex.

The type system makes it impossible.

(there are no methods on std::sync::Mutex which give access)

And we can't accidentally forget to unlock the mutex either.

Once the guard is dropped, the mutex gets unlocked.

Except...

(there is always an except...)

If the thread holding the mutex guard panics.

Then, when the guard is being dropped.

(since panics don't prevent drops)

Rather than Mutex being unlocked, is poisoned.

(you might have seen that mentioned in the code above)

We won't go further into mutex poisoning.

But if you're interested, check the Mutex documentation for more information.

mutex sequence diagram

Let's try to visualise two threads accessing our protected object.

I've simplified some things.

For example, we can't actually just pass a mutex when spawning 2 threads.

We need to wrap it in a smart pointer.

But we'll see how to do that later.

And it's not important for the purpose of this example.

Sequence diagram showing two threads accessing the mutex protected MyObject.

Here we can see how two threads try to lock the mutex.

Only Thread 1 succeeds.

So Thread 2 is parked.

(it stops executing)

Once Thread 1 drops the mutex guard, the mutex is unlocked.

Then Thread 2 can obtain the lock and do its work.

Now, let's get back to using that MutexGuard an an async context.

(and by using, I mean using it wrong)

hold-mutex-guard async function

So let's imagine that we've got a use case where we want a mutex held across an await point.

This could be:

  1. Read shared counter
  2. Access async shared resource (a database handle perhaps?)
  3. Write new value to shared counter

I'm sorry I couldn't come up with a more convincing example.

But this will do.

Now, let's replace our async shared resource with yielding back to the runtime.

Because we don't actually care about what it is.

(this will make things simpler later on)

Here's our async function.

use std::sync::{Arc, Mutex};

async fn hold_mutex_guard(data: Arc<Mutex<u64>>) -> Result<(), DataAccessError> {
    let mut guard = data.lock().map_err(|_| DataAccessError {})?;
    println!("existing value: {}", *guard);

    tokio::task::yield_now().await;

    *guard = *guard + 1;
    println!("new value: {}", *guard);

    Ok(())
}

Let's run through it.

Our future takes some data.

Actually it's an Arc<Mutex<u64>>.

Let's look at this from the inside out.

Our value is a u64.

(because life is too short for 32-bit numbers)

We want to access and modify our value from multiple tasks though.

So it's wrapped in a Mutex.

We already looked at the basics of mutexes and mutex guards in rust.

Finally, we need to access our mutex from multiple tasks.

(this is the bit we skipped over in the aside section)

So it's wrapped in a std::sync::Arc.

An Arc is actually an acronym: ARC.

Atomically Reference Counted.

It's a shared pointer.

It can be cloned and passed around between tasks.

(and threads)

All the while, giving access to the same location in memory.

The location where our mutex is!

Cloning an Arc just increments the reference counter.

(atomically in this case)

(the non-atomic version of Arc is std::rc::Rc)

It doesn't clone the underlying data, which is what we want.

(remember that bit about locking a different mutex not being useful)

So what we do is the following.

We lock the mutex.

(now only we have access to it)

We print out the value of our shared data.

Now we "access our async resource".

(actually we just yield back to the runtime)

(we looked at yield_now in part 2)

Then update the value of the shared data.

And print that out.

And we're done!

clippy is watching

It's worth mentioning that while this code compiles, clippy doesn't like it.

There is a lint for holding a mutex guard across an await point.

So turn on Clippy lints!

We're not going to run Clippy though.

Because we like living dangerously.

(mostly because we're trying to do the wrong thing)

that return type

You may have noticed something.

The return type!

Locking a mutex can fail.

(remember poisoning)

So we should return an error in this case.

It is good practice to make your errors explicit and minimal.

So here we've defined a new error for this case.

It's very simple, and I won't go into it.

But here it is for reference.

use std::{error::Error, fmt};

#[derive(Debug)]
struct DataAccessError {}

impl fmt::Display for DataAccessError {
    fn fmt(&self, f: &mut fmt::Formatter<'_>) -> fmt::Result {
        write!(f, "there was an error accessing the shared data")
    }
}

impl Error for DataAccessError {}

If you put all of this into a project, it will compile.

So let's execute it.

running the hold-mutex-guard async function

Let's call our future.

Or rather await it.

We'll use the #[tokio::main] macro for brevity.

In part 2, we looked at unwrapping async main().

We'll probably look at unwrapping it for great clarity later on.

For now, we have a nice simple main function.

#[tokio::main]
async fn main() {
    let data = Arc::new(Mutex::new(0_u64));

    hold_mutex_guard(Arc::clone(&data))
        .await
        .expect("failed to perform operation");
}

We create our data.

(initial value of 0)

And then we await our future.

Remember: this is a naughty async function.

It's holding a mutex guard across an await point!

So let's see what happens when we await it.

existing value: 0
new value: 1

It works.

(that is just a little disappointing)

Clearly, we're going to have to try harder to do bad things.

aside: spawn

We can't just await our async function twice in succession.

Because then it will run successively.

(one time after the other)

However, there is a way to run multiple futures concurrently on an async runtime.

It's called spawn, like the function to create a new thread.

In the case of Tokio, it is tokio::spawn.

(technically, it's tokio::task::spawn)

(but it's aliased at tokio::spawn and that's how it's generally used)

A huge difference when using tokio::spawn is that you don't need to .await.

The future will be set to execute immediately in a new task.

In fact, this is how we end up with more than one task.

(I know, we're up to part 3 and we've only just discovered multiple tasks)

But.

The new task may not get polled immediately.

It depends on how occupied the async runtime's workers are.

Let's create a simple example.

We'll use async/await syntax for brevity.

// `flavor`` has to be one of these values, not both. This code won't compile.
#[tokio::main(flavor = "current_thread|multi_thread")]
async fn main() {
    tokio::spawn(spawn_again());
    do_nothing().await;

    tokio::task::yield_now().await
    tokio::task::yield_now().await

    // ... Let's pretend there's more here and we're not returning yet.
}

async fn spawn_again() {
    tokio::spawn(do_nothing());
}

async fn do_nothing() {
    // There's nothing here
}

Here our async main function spawns a task with spawn_again

(an async function which will spawn another task)

And then it awaits an async function do_nothing.

(which does nothing)

The async function spawn_again spawns a task with do_nothing.

Let's see how this might work with different runtime schedulers.

spawn onto current-thread

An async runtime may only have one worker.

For example the current-thread scheduler in Tokio.

Then we could spawn a task from within another task.

But it wouldn't get polled until the current task yields to the scheduler.

(or maybe later if other tasks are waiting)

This is how it would look as a sequence diagram.

Sequence diagram representing the 3 futures in the code above being polled by a current thread scheduler.

Note how the tasks that get spawned need to wait until the runtime is free.

Then they will get polled.

But when a task .awaits a future, there is no new task.

And it gets polled immediately.

spawn onto multi-thread

Instead, a runtime may have multiple workers.

(which means multiple threads)

Like the multi-thread scheduler in Tokio.

Then there can be as many tasks being polled in parallel as there are workers.

Let's take a runtime with 2 workers and see how that would look as a sequence diagram.

Note that there is now parallelism.

So the exact order of operations may vary.

Sequence diagram representing the 3 futures in the code above being polled by a multi-thread scheduler.

This diagram contains a bit of a lie concerning how Tokio works.

Tasks are actually spawned onto the same worker that the spawning task is running on.

If another worker is idle, it may steal tasks from the first worker's queue.

(but all this is out of scope, so we'll continue)

wait for me to finish

Spawn returns a join handle: tokio::task::JoinHandle.

The join handle can be used to wait for the completion of the task.

(the join handle implements Future so it can be .awaited just like any future!)

It can also be used to abort the spawned task.

(which is another story for another day)

Let's get back to trying to break something.

spawning multiple async functions

Let's spawn a couple of instances of our async function!

#[tokio::main]
async fn main() {
    let data = Arc::new(Mutex::new(0_u64));

    tokio::spawn(hold_mutex_guard(Arc::clone(&data)));
    tokio::spawn(hold_mutex_guard(Arc::clone(&data)));
}

Now we'll run it and...

Oh.

It doesn't compile.

And we get a lot of errors.

Many of those errors are duplicates.

Because we called spawn twice.

So we'll comment out one of the spawn lines.

And now the errors are a bit more manageable.

(by the way, the person who writes a syntax highlighter for rustc output will be my hero forever)

error: future cannot be sent between threads safely
   --> resources/understanding-async-await/src/bin/mutex_guard_async.rs:5:18
    |
5   |     tokio::spawn(hold_mutex_guard(Arc::clone(&data)));
    |                  ^^^^^^^^^^^^^^^^^^^^^^^^^^^^^^^^^^^ future returned by `hold_mutex_guard` is not `Send`
    |
    = help: within `impl Future<Output = Result<(), DataAccessError>>`, the trait `Send` is not implemented for `std::sync::MutexGuard<'_, u64>`
note: future is not `Send` as this value is used across an await
   --> resources/understanding-async-await/src/bin/mutex_guard_async.rs:15:29
    |
12  |     let mut guard = data.lock().map_err(|_| DataAccessError {})?;
    |         --------- has type `std::sync::MutexGuard<'_, u64>` which is not `Send`
...
15  |     tokio::task::yield_now().await;
    |                             ^^^^^^ await occurs here, with `mut guard` maybe used later
...
21  | }
    | - `mut guard` is later dropped here
note: required by a bound in `tokio::spawn`
   --> /Users/stainsby/.cargo/registry/src/index.crates.io-6f17d22bba15001f/tokio-1.27.0/src/task/spawn.rs:163:21
    |
163 |         T: Future + Send + 'static,
    |                     ^^^^ required by this bound in `spawn`

OK, it's really just one error.

And two notes.

Let's read through.

The error itself first.

error: future cannot be sent between threads safely

A spawned task may be started on any worker (thread).

Even a current-thread runtime may have a task spawn from another thread.

(this would mean that the task is spawned from outside the runtime, which is just fine)

So this makes sense that a future needs to be able to be sent between threads.

But why can't it?

The first note tells us.

note: future is not `Send` as this value is used across an await

It then points us to mut guard.

And tells us that it isn't Send.

And then points to the .await where we yield as the offending await point.

(rust errors are amazing!)

Finally, the error goes on to tell us that it is all spawn's fault!

note: required by a bound in `tokio::spawn`

This Send stuff isn't magic.

It is specified explicitly on tokio::spawn by the tokio authors.

Let's go an have a look at the code for it.

(tokio::spawn from the tokio-1.29.1 tag)

pub fn spawn<T>(future: T) -> JoinHandle<T::Output>
where
    T: Future + Send + 'static,
    T::Output: Send + 'static,
{
    // (we're skipping the actual implementation)
}

We see that spawn is generic over T.

And there are some constraints on what T can be.

In Rust, these "constraints" are called bounds.

(ohhhh, that's what a bound is!)

So we can see that T must implement Future and Send and have a 'static lifetime.

We're going to skip over the lifetime.

Lifetimes is a whole other series.

That the type must implement Future makes sense.

This is the whole point of spawn after all.

And we kind of understand why this future can't be sent between threads.

But how does a type "implement" Send?

aside: marker traits

Rust has a concept called "marker traits".

(you can find them in the standard library std::marker)

These are traits that don't have any methods.

Mandatory or otherwise.

So they're not implemented in the traditional sense.

But when applied to types, they indicate intrinsic properties.

(intrinsic properties means things about the type by itself)

In the case we're looking at, the Send trait indicates that a type can be safely sent between threads.

And all along we thought that the Rust compiler was so clever that it could work that out by itself?

(at least this is what I thought for a long time)

If we look at the std::marker::Send trait more closely, we'll see something.

It's unsafe!

Yes, it follows that clever Rust convention.

When the compiler can't work out that something is safe by itself.

(but we know that it's safe)

Then we use unsafe to indicate that we, the authors of this code, are vouching for its safety.

(in this case, it's not us, it's the authors of the standard library)

(and if you can't trust them to write safe things...)

By default, a struct will be Send if everything in it is Send.

So mostly we don't have to worry about specifying things as send.

But we need to be wary of where we can use types that aren't send.

back to trying to break things

Rust's type system has foiled our plans.

Our plans of doing something bad with a mutex guard and an await point.

But we can probably still provoke something bad.

We don't need to run our not Send async function twice concurrently.

We just need to try to lock that mutex from somewhere else.

So let's create another async function that we can spawn.

It's the same as the previous one, but without the yield.

(and therefore, without an await point)

(so it's not really async)

async fn yieldless_mutex_access(data: Arc<Mutex<u64>>) -> Result<(), DataAccessError> {
    let mut guard = data.lock().map_err(|_| DataAccessError {})?;
    println!("existing value: {}", *guard);

    *guard = *guard + 1;
    println!("new value: {}", *guard);

    Ok(())
}

We're not holding the guard across an await point.

So this async function is Send!

We need to make one more change.

To ensure that this breaks.

(because this is all pretty simple)

We're going to use a current-thread runtime.

This means that tasks won't run in parallel.

So it's easier to create certain situations.

#[tokio::main(flavor = "current_thread")]
async fn main() {
    let data = Arc::new(Mutex::new(0_u64));

    tokio::spawn(yieldless_mutex_access(Arc::clone(&data)));
    hold_mutex_guard(Arc::clone(&data))
        .await
        .expect("failed to perform operation");
}

Here we spawn our Send async function yieldless_mutex_access().

And then immediately await our bad function hold_mutex_guard().

Let's check the output.

(yes, it does compile, that's a good start)

existing value: 0

And then it just hangs there.

Forever.

We've created a deadlock!

(give yourself a pat on the back)

(we got there in the end)

Now, it's time to understand why.

So we'll go back to our old tricks.

And write a custom Future for our async function.

hold-mutex-guard future

We're going to manually implement a future that does the same.

I almost didn't manage this one.

(in fact, I didn't manage it)

(luckily I know some smart people who helped me)

(thank you!)

Now, on to that future.

Futures are generally implemented as state machines.

(we've seen this a few times before)

We'll need an initial state.

(before being polled)

And we like to have an explicit completed state.

(which will panic if polled again)

And in the middle, a state after having yielded once.

With that in mind, our future could look like the following.

use std::sync::{Arc, Mutex};

enum HoldMutexGuard<'a> {
    Init {
        data: Arc<Mutex<u64>>,
    },
    Yielded {
        guard: MutexGuard<'a, u64>,
        _data: Arc<Mutex<u64>>,
    },
    Done,
}

Our initial state needs the parameters that the async function receives.

The yielded state is going to have our guard stored in it.

(this is the bit we're doing wrong, of course)

We also need the Arc containing our data.

This matches what our async function would have had generated.

(more on why later)

The MutexGuard requires a lifetime generic parameter.

(which is a total pain by the way)

(but that's the point, it's there for a good reason)

That means that our future will also need a lifetime generic parameter.

We'll wrap the soon-to-be-future up in a function.

(why? see part 2)

fn hold_mutex_guard(
    data: Arc<Mutex<u64>>,
) -> impl Future<Output = Result<(), DataAccessError>> {
    HoldMutexGuard::Init { data }
}

We're using the same error type too.

Before we implement anything, let's pause.

And take a look at the state machine for HoldMutexGuard.

State machine of the HoldMutexGuard future.

It's not much more complicated than YieldNow's state machine.

The future starts in the Init state.

When polled the first time, it returns Poll::Pending.

And moves to the Yielded state.

When polled the second time, it returns Poll::Ready.

And moves to the Done state.

The implementation is a little more complex though.

implementing the hold-mutex-guard future

Now onto the good stuff.

Implementing Future.

impl<'a> Future for HoldMutexGuard<'a> {
    type Output = Result<(), DataAccessError>;

    fn poll(mut self: Pin<&mut Self>, cx: &mut Context<'_>) -> Poll<Self::Output> {
        let state = &mut *self;
        match state {
            Self::Init { data } => {
                let guard = unsafe {
                    // SAFETY: We will hold on to the Arc containing the mutex as long
                    //         as we hold onto the guard.
                    std::mem::transmute::<MutexGuard<'_, u64>, MutexGuard<'static, u64>>(
                        data.lock().map_err(|_| DataAccessError {})?,
                    )
                };
                println!("existing value: {}", *guard);

                cx.waker().wake_by_ref();
                *state = Self::Yielded {
                    guard: guard,
                    _data: Arc::clone(data),
                };

                Poll::Pending
            }
            Self::Yielded { guard, _data } => {
                println!("new value: {}", *guard);

                *state = Self::Done;

                Poll::Ready(Ok(()))
            }
            Self::Done => panic!("Please stop polling me!"),
        }
    }
}

It's not as bad as it looks!

Our Output associated type is the same as our function return parameter.

That's easy.

So let's look at the implementation for poll().

Wait, wait, wait.

What is this beast?

let state = &mut *self;

The borrow checker has lots of fun with anything to do with Pin.

(but we're still not going to discuss pinning today)

We need to modify self.

But it's pinned.

And we need to reference parts of it as well.

So we dereference our pinned self.

Then take a mutable reference.

(this is all legit and the borrow checker is happy)

The first time we get polled, we'll be in the state Init.

So we'll do everything up to the yield_now call in our async function.

a little bit of unsafe

Unfortunately we come up against the borrow checker again.

We can't just take our MutexGuard and store it next to the Mutex it's guarding.

That would create a self-referential structure.

And Rust is all against those.

In fact it's so against those that we have to use unsafe to do what we want.

(admittedly, what we're trying to do is wrong from the start)

(so it's not that surprising)

What we're going to do is create a MutexGuard with a 'static lifetime.

That means, we're telling the borrow checker that it will last as long as it needs to.

In our case, this is legitimately OK.

This is why we keep the Arc stored even though we don't need it.

As long as we hold that Arc to the Mutex, the MutexGuard can be valid.

To do this magic, we use std::mem::transmute.

(it's alchemy!)

This will reinterpret the bits of one value as another.

This allows us to take the MutexGuard with some other lifetime.

And turn it into (transmute) a MutexGuard with a static lifetime.

If this doesn't make too much sense, don't worry.

It's not necessary to understand the rest.

But keep in mind that Rust wants to protect us here.

And we are very carefully going around that protection.

(here be dragons, don't do this at home, etc.)

holding onto that guard

Once we have our MutexGuard, we print the value.

We're now going to yield back to the runtime.

So just like in our YieldNow future, we need to wake our waker first.

Otherwise our future will never be polled again.

Then we set the next state: Yielded.

(using that funny &mut *self)

And return Poll::Pending.

The next time our future gets polled, we are already in state Yielded.

We will print the value from the MutexGuard.

Then move to state Done and return Poll::Ready.

At that point, the MutexGuard will get dropped.

That's the end of the implementation.

The important bit here is that in the Yielded state, we hold on to the MutexGuard and return.

This is what our async function is doing too.

But we don't see it so clearly.

We just see .await.

But every time your async function contains an await point, that is the future returning.

(potentially)

And before returning, it has to store all the in-scope local variables in itself.

hanging around again

Let's reproduce that hanging program again with our future.

Just to make sure we can.

We're going to spawn the same async function to help provoke the hang as we did before.

That's yieldless_mutex_access as described in back to trying to break things.

(the one that doesn't actually do anything async)

(we're mixes paradigms a bit, but implementing this future isn't interesting)

And we'll unwrap async main() straight away.

(I told you we would get to this)

This leaves us with an unwrapped version of the same code we used before.

fn main() {
    let body = async {
        let data = Arc::new(Mutex::new(0_u64));

        tokio::spawn(yieldless_mutex_access(Arc::clone(&data)));
        hold_mutex_guard(Arc::clone(&data))
            .await
            .expect("failed to perform operation");
    };

    return tokio::runtime::Builder::new_current_thread()
        .enable_all()
        .build()
        .expect("failed to build runtime")
        .block_on(body);
}

We're creating a current-thread runtime.

Same as before.

(this makes triggering hanging behaviour easier)

(and we do like easy)

Let's have a look at the sequence diagram!

Because that's going to help us see what's happening.

Sequence diagram of the HoldMutexGuard future.

The important point is the two futures.

yieldless_mutex_access() gets spawned first.

Then HoldMutexGuard gets awaited.

As we saw when we introduced spawn, the new task has to wait.

The runtime is single threaded.

So the new task created with yieldless_mutex_access() must wait until the current task yields to the runtime.

This means that the HoldMutexGuard future is run first.

It locks the mutex and receives a MutexGuard.

It wakes it's waker.

(so it will get polled again after returning Poll::Pending)

Then changes state to Yielded, storing the MutexGuard in itself.

And then returns Poll::Pending.

Yielding to the runtime.

Now the runtime can poll the next task.

The one spawned with yieldless_mutex_access().

This task locks the mutex.

Well, it tries.

But the mutex is already locked, so it blocks until it gets unlocked.

Since the runtime only has one thread, this blocks the entire runtime.

And causes a deadlock.

We saw this before with our async function.

And now we understand why!

now what?

So, what should we do if we want to control access to some shared async resource?

The obvious answer is to use the async mutex in tokio.

It's called tokio::sync::Mutex.

It is safe to hold this mutex's guard across await points.

This is because its lock() method is async.

So it won't block the thread while waiting for the lock.

And so some other task holding the lock can make progress.

(and release the lock)

However, it is often better not to use a mutex at all.

Instead, give full ownership of your shared resource to a single task.

And communicate with that task via message passing.

This is a topic for a whole other blog post though.

So we won't go into it here.

In part 4, we look at message passing and channels.

You can go and read it now!

See you next time!

thanks

A huge thank-you to Conrad Ludgate and Predrag Gruevski for help in writing the manual future (especially that MutexGuard transmute). This post would have been cut short without that.

Twelve points go Daniel "Yandros" Henry-Mantilla for pointing out that drop() does get called during a panic. This is detected by the MutexGuard and used to poison the Mutex. This was submitted as the first ever PR on my web-site repo!

Thanks to sak96 for reminding me that there is a lint for holding a guard across an await point.

(in alphabetical order - sort of)

how I finally understood async/await in Rust (part 2)

on Thursday, 29 June 2023

This is the second part in a series on understanding async/await in Rust.

Or rather, on how I understood async/await.

As you're not me, this may or may not help you understand too.

(but I hope it does)

Here's the full list of posts in the series.

In the previous part, we looked at the simplest async function.

An async function so simple that it doesn't do anything async.

Then we wrote a custom future to do the same thing.

Doing this, we understood why our simplest future really is async.

Why it doesn't execute the contents until it is awaited.

In that exploration, an important part of our future was skipped.

(actually, we skipped a lot of things that will become important)

(but those things weren't important at the time, so skipping was ideal)

Our future only ever returned Poll::Ready.

But what about a pending future?

Let's look at what happens when we return Poll::Pending

how does a pending future get woken?

First, let's recap what happens when a future gets polled.

We can create an even simpler future than the Hello, World one.

ready future

This future will do nothing except return Poll::Ready.

We don't even need any members for this.

So we'll start with a unit struct and implement Future for it.

use std::{future::Future, task::Poll};

struct Ready;

impl Future for Ready {
    type Output = ();

    fn poll(
        self: std::pin::Pin<&mut Self>,
        _cx: &mut std::task::Context<'_>,
    ) -> std::task::Poll<Self::Output> {
        println!("Ready: poll()");
        Poll::Ready(())
    }
}

We won't have a return value, so Output is the unit type ().

The implementation of the poll method is simple.

It returns Poll::Ready(()).

(the extra brackets in there is the unit type () again)

In part 1 we visualised a state machine of the future we wrote.

Even though the Ready future is even simpler, let's check the state machine.

State machine of the Ready future.

Here it becomes clear that we don't have states in this future.

Additionally, there is no handling of the future being (incorrectly) polled after returning Poll::Ready.

All in all, it's a simple future.

Now let's wrap our future in a function.

fn ready() -> Ready {
    Ready {}
}

(we are returning the Ready unit struct that implements Future)

(not to be confused with Poll::Ready)

Since Ready implements the Future trait, we can await this function.

(we learned this in part 1)

#[tokio::main]
async fn main() {
    println!("Before ready().await");
    ready().await;
    println!("After ready().await");
}

If we run this, we see the expected output immediately.

Before ready().await
Ready: poll()
After ready().await

What happens behind the .await syntax is that the poll function gets called.

As it returned Poll::Ready, the result is passed straight back to the caller.

For completeness, here is the sequence diagram for our program using the Ready future.

Sequence diagram for the Ready future.

This future could be useful in test contexts.

In case you want a future that always returns ready.

In fact, other people think it's useful too.

There's a generic version in the futures crate: futures::future::ready

But we want to know about not returning Poll::Ready.

So let's have a look!

pending future

(I think that pending future might be a good name for a band)

Let's try to create an equivalent of the ready future, but pending.

The same as for Ready, we'll create a unit struct.

This time called Pending.

Then we'll implement the Future trait for it.

use std::{future::Future, task::Poll};

struct Pending;

impl Future for Pending {
    type Output = ();

    fn poll(
        self: std::pin::Pin<&mut Self>,
        _cx: &mut std::task::Context<'_>,
    ) -> Poll<Self::Output> {
        println!("Pending: poll()");
        Poll::Pending
    }
}

Even though we need to define the associated type Output, it isn't used.

This is because when a future returns Poll::Pending the return value isn't ready yet.

(that's why we're not returning Poll::Ready, because it's not ready)

As before, we'll wrap our Pending future in a function.

fn pending() -> Pending {
    Pending {}
}

(we are returning the Pending unit struct that implements Future)

(not to be confused with Poll::Pending)

aside: why do we keep wrapping futures in functions?

You might ask yourself, why do we keep wrapping futures in functions?

(or you might ask me)

This is for two reasons.

Reason one is style.

In this blog series, we're exploring what async/await does under the cover.

So it's nice to compare apples to apples.

(or at least compare functions to functions)

Basically, look at a function that can be awaited like an async function can be.

Reason two is abstraction.

By constructing the future in our own function, we can hide the details from the user of our API.

We can even go so far as to prevent the construction of our future outside of our own crate or module.

This makes backwards compatibility easier.

We can go further than this.

We don't need to declare that we're returning our type from the function at all.

We could instead return something that implements the Future trait.

Because the Future trait has the associated Output type, we need to specify that too.

But that's everything.

Let's rewrite our pending function in this way.

fn pending() -> impl Future<Output = ()> {
    Pending {}
}

Now we don't need to make Pending public at all!

back to pending

It doesn't matter which return declaration we use.

(either Pending or impl Future<Output = ()>)

We can still .await on the return value of pending().

So let's start up our async runtime and try it out!

#[tokio::main]
async fn main() {
    println!("Before pending().await");
    pending().await;
    println!("After pending().await");
}

You should read a few of lines ahead before executing this.

(in case you're building everything as we go)

(trust me, it's important)

First, here's the output.

Before pending().await
Pending: poll()

Don't wait for the program to end.

This program won't end.

It will hang there forever.

It won't use a lot of CPU.

It won't block the execution of the thread.

But it won't go any further.

And what is also clear is that poll() only gets called once!

Our future is never polled again after returning Poll::Pending.

It's true that this future seems broken in all sorts of ways.

But it can be useful in certain scenarios, like tests.

And just like our ready() example, there's a generic version in the futures crate: futures::future::pending.

Back to why Pending is hanging our program.

Let's check our state machine.

Maybe the state machine can explain what's happening.

State machine of the Pending future.

We used a dotted line to indicate on the path to Final.

This is to indicate that this object will likely never be dropped.

We don't really have a good way to show this on the sequence diagram.

(this is an observation, not based on any knowledge of what is happening)

In the end, the state machine for Pending looks a lot like the one for Ready.

What about the sequence diagram?

Sequence diagram for the Pending future.

This isn't very enlightening either.

Why doesn't our program advance?

From the sequence diagram above, it's not entirely clear.

We see that our future returns Poll::Pending to our async main() function.

But we don't see the println! invocation that follows.

This flow is actually a small lie.

We need to dig in a bit deeper to understand what is happening.

unwrapping async main()

Part of that lie is how async main() works.

Specifically what the #[tokio::main] macro does.

The other part is what .await does underneath.

(and of course what .await does underneath is what this series is all about)

Let's unwrap #[tokio::main] and have a look at what is inside!

fn main() {
    let body = async {
        println!("Before pending().await");
        pending().await;
        println!("After pending().await");
    };

    return tokio::runtime::Builder::new_multi_thread()
        .enable_all()
        .build()
        .expect("Failed building the Runtime")
        .block_on(body);
}

This was done with Rust Analyzer's Expand macro recursively command.

(I removed some clippy allows to simplify)

We can now see that the body of our async main() function is actually placed in an async block.

Then a new runtime is created and given the async block to run.

(we use block_on to give the runtime a future and wait until it finishes)

To clarify, an async block is also just a future!

We now have a better understanding of what our async main() function was actually doing.

So let's update the sequence diagram as well.

Sequence diagram for the Pending future, this time with the [tokio::main] macro unwrapped.

We now see that it's actually the async runtime that is calling poll() on the future which is driving the main task.

(you probably guessed this already)

(but confirmation is nice)

The main future awaits our Pending future.

There's something important to note when a future awaits some sub-future which returns Poll::Pending.

Then the future also returns Poll::Pending back to its caller.

In this case that goes back to the async runtime.

When the task being polled returns Poll::Pending the task itself goes to sleep.

(it's tired, let the poor thing rest)

The async runtime then picks another task to poll.

(it might poll the same task again if it can be polled)

In order for our task to be polled again, it needs to wake up.

But maybe there are no tasks which are scheduled to be polled.

(scheduled to be polled means awake)

In that case, the async runtime parks the thread until a task gets woken.

So, the big question is: when does a task wake up?

Answer: when the waker wakes it.

(a more tautological answer would be impossible)

It turns out that there is a more important question first.

(well, two questions)

What is a waker?

Where can I get one?

the waker

When we're talking about a waker, we're talking about std::task::Waker.

It's a struct in the standard library.

What do the docs say?

A Waker is a handle for waking up a task by notifying its executor that it is ready to be run.

So now we know, we can use the waker to wake up our task.

(tautological as ever, but it really is that simple)

You call wake() or wake_by_ref() on the waker for a task.

Then the task wakes up and polls the future again.

But where do we get one of these from.

More importantly, where do we get a waker for our task.

Remember back to part 1 of this series.

In the section aside: the easy bits of the Future trait.

I said the following:

We also don't need the context for now, so we'll skip that too.

This was in reference to the second parameter to the poll function: cx: &mut Context<'_>

Well, skipping time is over, we now need to understand the context.

aside: context

The context is the way that information about the current async task is given to a future.

We are specifically talking about std::task::Context.

We skipped over it in part 1.

We had no need for it.

But the truth is that the context is not complicated.

Let's read the description straight from the docs.

Currently, Context only serves to provide access to a &Waker which can be used to wake the current task.

(that's it?)

(yes, that's it)

In fact, Context only has two methods.

The first is from_waker which constructs a context from a reference to a waker.

The second is waker which takes a reference to the context and returns a reference to the waker.

In reality, I think that the Context struct is just forward thinking API design.

(this is my uninformed opinion)

(but there's surely an RFC somewhere that explains the real reason)

It may be that in the future, asynchronous tasks have more context.

Not just the waker.

By wrapping the waker like this, that extension would be possible.

If the poll function took the waker as a parameter directly, it wouldn't be.

Now we know what a waker is.

And we know where to get one.

Let's write a future that doesn't hang our asynchronous task forever!

pending but not forever

We want to write a future that returns Poll::Pending but doesn't hang forever.

We're all about easy.

So let's do this the easiest way possible.

We need to make 2 changes to our Pending future.

Change 1 is to return Poll::Pending only once.

From the second call to poll(), we will instead return Poll::Ready.

But this by itself isn't enough.

As we've seen, poll() won't get called again until the task gets woken.

So change 2 is to wake our task.

And we can do this before we return Poll::Pending.

(which is the easiest way)

(this is called a self wake in tokio-console, in case you were wondering)

Yes, this works just fine!

We're going to call this future YieldNow.

(for reasons we'll see a little later)

Different to our Ready and Pending futures, we need some state.

Let's look at the code.

use std::{future::Future, task::Poll};

struct YieldNow {
    yielded: bool,
}

impl Future for YieldNow {
    type Output = ();

    fn poll(
        mut self: std::pin::Pin<&mut Self>,
        cx: &mut std::task::Context<'_>,
    ) -> Poll<Self::Output> {
        println!("YieldNow: poll()");
        if self.yielded == true {
            return Poll::Ready(());
        }

        self.yielded = true;

        cx.waker().wake_by_ref();

        Poll::Pending
    }
}

Our YieldNow struct has a single field.

This determines whether we've "yielded" yet.

Yielding in this context means returning control to the async runtime.

So "yielding" is really just "returning Poll::Pending".

If we've already yielded, we return Poll::Ready.

If we haven't, we set yielded to true.

Then we wake the waker!

And finally return Poll::Pending.

But because we've already woken our task, we've indicate that we're ready to be polled again.

So our task won't hang!

As usual, let's wrap our future in a function.

fn yield_now() -> YieldNow {
    YieldNow { yielded: false }
}

Now we can try calling it!

(we'll keep our explicit runtime creation)

fn main() {
    let body = async {
        println!("Before yield_now().await");
        yield_now().await;
        println!("After yield_now().await");
    };

    return tokio::runtime::Builder::new_multi_thread()
        .enable_all()
        .build()
        .expect("Failed building the Runtime")
        .block_on(body);
}

Now we get the desired output immediately.

Before yield_now().await
YieldNow: poll()
YieldNow: poll()
After yield_now().await

No more hanging!

And we can clearly see that poll() gets called twice on YieldNow.

We've written our first future with a waker.

Definitely time to celebrate!

Yield Now

As I mentioned above, we call returning control to the runtime yielding.

This is what happens at every await point that returns pending.

(remember that when a future awaits another future and receives Poll::Pending it also returns Poll::Pending)

(if you have a custom future calling poll() directly, this may not be the case)

Our yield_now() function is voluntarily yielding control to the runtime.

It's voluntarily because the task isn't actually waiting for anything.

The task could otherwise keep progressing.

The name isn't mine.

(I "borrowed" it)

There is a function to do this in Tokio: tokio::task::yield_now.

(although the tokio implementation is a little more complicated)

(but we can skip that complicatedness for now)

Let's have a look at the state machine for YieldNow.

State machine of the YieldNow future.

Here we include the poll() return value in the transition.

The future starts with yielded = false.

The first time it is polled, it returns Poll::Pending() and transitions to yielded = true.

From there, the future will return Poll::Ready(()) from any further calls to poll().

This state machine is no more complicated than the HelloWorld future from part 1.

The more interesting part is the sequence diagram.

So let's check it out.

Sequence diagram for the YieldNow future.

The YieldNow future is very similar to the Pending future.

Until it calls wake_by_ref() on the waker.

(we saw this function when we introduced the waker)

The waker then calls to the async runtime to schedule() the current task.

(as always, this sequence is logically correct and optimised for understanding)

(it is not exactly matching what happens internally in Tokio)

Now the task is scheduled.

And so we see a difference when the task returns Poll::Pending back to the runtime.

The runtime now does have a task ready to poll (scheduled).

So it doesn't park the thread.

Instead it polls the task again straight away.

This time, our YieldNow future returns Poll::Ready.

Since the task that we called block_on with is finished, the runtime returns control to main().

And it returns the value from our future.

In this case there is no value, so it returns the unit type.

And now we understand how a pending future gets woken!

This post is part of a series.

And part 3 is available to read right now.

thanks

A huge thank-you to arriven, Conrad Ludgate, and sak96 for reviews and suggestions!

(in alphabetical order)

how I finally understood async/await in Rust (part 1)

on Tuesday, 30 May 2023

Like an increasing number of Rustaceans, I came to Rust after async/await had been stabilised.

(strictly speaking this isn't true, but close enough)

I didn't understand what was happening behind those magic keywords.

async

.await

This made it hard for me to grasp why I had to do things in a certain way.

I wanted to share how I finally understood async Rust.

We'll do this via a series of questions that I had.

We'll explore them in a series of posts.

These were originally going to all go in one post.

But it turned out to be a bit big.

Also, these topics might change order.

Or I might add more.

But first, I'll answer the question on everyone's mind...

why are you writing another beginners guide to async/await?

There are many different beginner guides on async Rust available.

Why am I writing yet another one?

Personally, nothing I read about async/await made everything click.

This is common.

Different people learn things in different ways.

Maybe no one has written the guide that allows you to understand.

Or maybe there's some piece you don't quite get.

Then reading one more guide fills in that gap so that you do get it.

This post describes how I finally understood.

If it helps you get there, great.

If it doesn't, maybe it's a stepping stone on the way.

Some other guides that I particularly liked are:

why doesn’t my task do anything if I don’t await it?

Let's get stuck in.

Perhaps the first hurdle newcomers to async Rust meet is that nothing happens.

Here's an example.

tokio::time::sleep(std::time::Duration::from_millis(100));

This will not sleep.

The compiler will immediately warn you that this won't work.

   = note: futures do nothing unless you `.await` or poll them

Right, let's fix it.

tokio::time::sleep(std::time::Duration::from_millis(100)).await;

Now we're sleeping!

That's all well and good.

But why?

Normally when I call a function, the contents get executed.

What is so special about that async keyword that all my previous experience must be thrown away?

To answer this question, let's look at perhaps the simple async function.

(the simplest that does something)

Generally, guides start with an async function that calls some other async function.

This is simple.

But we want simpler.

We want, hello world.

the simplest async function

We're going to start with an async function that doesn't do anything async.

This might seem silly.

But it will help us answer our question.

async fn hello(name: &'static str) {
    println!("hello, {name}!");
}

We can then call this function in a suitable async context.

#[tokio::main]
async fn main() {
    hello("world").await;
}

Our output is as expected.

hello, world!

But what does this function actually do.

We know that if we remove the .await, nothing happens.

But why?

Let's write our own future that does this.

Specifically, we'll be implementing the trait std::future::Future.

What's a future?

aside: futures

A future represents an asynchronous computation.

It is something you can hold on to until the operation completes.

The future will then generally give you access to the result.

It's a common name for this concept in many different programming languages.

The name was proposed in 1977 apparently, so it's not new.

(read Wikipedia for more gory details)

What we need to know is that a future is what you give an async runtime.

You do this by .awaiting it.

Then the runtime gives you back the result.

the simplest future

Let's write our simple async function as a future.

A future generally has multiple states.

In fact, most futures are "basically" state machines.

The state machine is driven through it's states by the async runtime.

At a minimum we want 2 states, we'll call them Init and Done

The Init state is what the future starts in.

The Done state is where the future goes once it's complete.

That's simple.

So we'll model our future as an enum.

In the Init state, we need to keep the parameters that would be passed to the async function.

enum Hello {
    Init { name: &'static str },
    Done,
}

state machine diagram

As I said about, a future is a state machine.

So let's draw a state machine!

State machine of our hello world future.

We'll see this in code shortly in implementing poll.

In short, our Hello enum is constructed into the Init state.

Something called poll() on it, transitioning it to the Done state.

(more about poll() below)

That's it.

The object can now only be dropped.

(deconstructed)

This might not make sense yet.

But it should help understanding the code.

This isn't a future yet, so we can't await it.

To fix that, we need to implement the Future trait.

aside: the easy bits of the Future trait

We're going to just look at the easy bits of the std::future::Future trait.

First, let's look at the trait:

pub trait Future {
    type Output;

    // Required method
    fn poll(self: Pin<&mut Self>, cx: &mut Context<'_>) -> Poll<Self::Output>;
}

The Future trait has an associated type that defines the output.

This is what an async function would return.

Our hello function doesn't return anything, so let's skip it for now.

There is one required method that takes a mutable reference to self and a context.

The reference to self is pinned.

We don't need to understand pinning for now.

So just think of it like any other &mut self.

We also don't need the context for now, so we'll skip that too.

The poll method returns a std::task::Poll enum.

The method should return Pending if it still has work to do.

(there are other things needed when returning Pending)

(but we can - yep, you guessed it - skip them for now)

When the future has a value to return, it returns Ready(T).

Here, T is the Future's associate type Output.

We don't actually need a value here either, so if you don't understand T, don't worry.

Skipping over the hard bits makes this easier.

implementing poll

Let's look at the implementation.

use std::{future::Future, pin::Pin, task::Context};

impl Future for Hello {
    type Output = ();

    fn poll(mut self: Pin<&mut Self>, _cx: &mut Context<'_>) -> Poll<Self::Output> {
        match *self {
            Hello::Init { name } => println!("hello, {name}!"),
            Hello::Done => panic!("Please stop polling me!"),
        };

        *self = Hello::Done;
        Poll::Ready(())
    }
}

Let's go through this bit by bit.

Our async function doesn't return a value.

This means that Output is the unit type ().

This is, in reality, also what our async function returns.

Onto the implementation of poll.

We match on *self.

(remember, Hello is an enum)

If we're in the initial state Init then print out hello, {name}!.

This is the body of our async function.

If we're in the Done state, we panic.

(more on this shortly)

After our match statement, we set our state to Done.

Finally, we return Ready(()).

(that means Ready with a unit type as the value)

(remember that a function that doesn't return anything, actually returns the unit type)

In a moment, we'll look at how to use our new future.

But first, we have a couple of topics pending.

(pun absolutely, 100%, intended)

What about Poll::Pending and what about that panic!.

pending futures

This future is very simple.

It will become ready on the first poll.

But what if that isn't the case?

That's where Poll::Pending is used.

We'll look at how to use Pending at a later date.

future panics

Wait!

What about that panic?

A future is a "one shot" object.

Once it completes - returns Ready(T) - it must never be called again.

This is described in the Panics section of the documentation for this trait.

The trait doesn't require that the future panic.

But it's good practice when you start out, as it will quickly catch some logic errors.

using our future

We need to construct our new future to be able to use it.

Let's wrap it up in a function like our async function.

fn hello(name: &'static str) -> impl Future<Output = ()> {
    Hello::Init { name }
}

The first thing we note about this function is that it isn't marked async.

Because we're returning a "hand made" future, we can't use the async keyword.

Instead we return impl Future<Output = ()>.

Translation: an object that implements the future trait with the associated type Object being the unit type.

We could also expose our custom future and return Hello directly.

(this works the same, because Hello implements the Future trait)

What about the body of the function?

We construct the Init variant of our enum and return it.

Now it's starting to become clear why an async function doesn't do anything if you don't await it.

We're not doing anything!

Just constructing an object, nothing else gets run.

So let's call our future.

We can't call poll().

We don't have a Context to pass to it.

(we could create a Context, but that's a story for another day)

(remember we want to understand how async/await works for the user, not for the async runtime)

Luckily, the await keyword works just fine on "hand made" futures.

(this is what the compiler creates under the hood, after all)

So let's await our future!

Here's our main function.

(note that it is async, we must always be in async context to await a future)

#[tokio::main]
async fn main() {
    hello("world").await;
}

Well, that's boring.

It's exactly the same as when hello() was an async function.

What about the output?

hello, world!

Also exactly the same.

This might seem like a bit of an anti-climax.

But remember, you've just written your first custom future in Rust!

(or maybe your second future, or your hundredth)

(have you really written 100 futures? nice!)

sequence diagram

Here's a sequence diagram of our Hello future.

Sequence diagram of our hello world async function.

It looks wrong that our async main() function is calling poll() directly.

But remember that main is also being poll()ed!

So it has everything needed to call poll() on Hello.

(specifically the context, but we're not worrying about the context)

I'll be creating similar sequence diagrams for each of the futures we write in this series.

Hopefully that will help tie the different concepts together.

Was this interesting?

Check out part 2.

task scheduled time in console

on Wednesday, 26 April 2023

Update (2023-05-10): A new version of tokio-console is available including this change!

Last week we merged a small set of cool changes in Tokio Console.

They added support for tracking and displaying per task scheduled time.

For the impatient amongst you, here's a screenshot.

Screenshot of tokio-console displaying the task details for the burn task in the app example.

But what is a task's scheduled time?

Actually, let's first make sure we're all on the same page.

What's a task?

tasks

We're discussing async Rust here.

So when I say task, I'm talking about it in that context.

From the Tokio documentation for tokio::task:

A task is a light weight, non-blocking unit of execution.

A task is like a thread, but lighter-weight.

The asynchronous runtime (e.g. Tokio) is responsible for scheduling tasks across its workers.

We won't go much more into detail than that for now.

scheduled time

We often think of a task as having 2 states.

Busy: when it's being executed.

Idle: when it's waiting to be executed.

Let's look at an example of a task moving between these two states.

Time-status diagram showing 1 task in one of 2 states: idle, busy.

We see that the task is either idle or busy.

When a task stops doing work, it yields to the runtime.

This is usually because it is awaiting some other future.

Although it could also voluntarily yield.

(in Tokio this is done by calling tokio::task::yield_now().await)

When a task yields to the runtime, it needs to be woken up.

Tasks get woken by a waker.

(tautologies galore)

We're not going to get into the mechanics of wakers today.

Enough to know that when a task is woken, it is ready to work.

But the runtime might not have a worker to place it on.

So there could be some delay between when a task is woken and when it becomes busy.

This is the scheduled time.

Time-status diagram showing 1 task in one of 3 states: idle, scheduled, busy.

Why is this interesting?

Let's have a look

scheduling delays

Let's look at a case with 2 tasks.

To make things simple, we'll suppose a runtime with only 1 worker.

This means that only a single task can be busy at a time.

Here's a time-status diagram of those's 2 tasks.

Time-status diagram showing 2 tasks, each in one of 2 states: idle, busy. There is no point at where both tasks are busy at the same time.

Nothing looks especially wrong.

(there is one thing, but we don't want to get ahead of ourselves).

But perhaps the behaviour isn't everything we want it to be.

Perhaps Task 2 is sometimes taking a long time to respond to messages from a channel.

Why is this?

We don't see it busy for long periods.

Let's include the scheduled time.

Time-status diagram showing 2 tasks, each in one of 3 states: idle, scheduled, busy. There is no point at where both tasks are busy at the same time. There is one moment when task 1 is busy for a long time and during part of that time, task 2 is scheduled for longer than usual.

Now something does jump out at us.

While task 1 is busy, task 2 is scheduled for a lot longer than usual.

That's something to investigate.

It also makes is clear that task 1 is blocking the executor.

That means that it's busy for so long that it doesn't allow other tasks to proceed.

Bad task 1.

That's the thing that a trained eye might have caught before.

But we don't all benefit from trained eyes.

scheduled time in the console

Tokio console doesn't have these pretty time-status diagrams.

Yet, at least.

But you can now see the scheduled time of each task.

Tokio console showing the task list view. There is a column labelled Sched for the scheduled time.

And sort by that column too.

Let's look at the task with the highest scheduled time, task2.

Tokio console showing the task detail view. There are 2 sets of percentiles and histograms. The top one is for poll (busy) times, the bottom one is for scheduled times.

It's quickly clear that task2 spends most of its time "scheduled".

Exactly 61.34% of its time when this screenshot was taken.

We can also see that during most poll cycles, task2 spends more than 1 second scheduled.

And at least once, over 17 seconds!

How about we have a look at a more common scheduled times histogram.

Let's look at the task details for the burn task that we saw at the beginning.

Tokio console showing the task detail view for the burn task. The scheduled times histogram is more as we'd expect, clustered around the lower end.

Here we see that the scheduled times are more reasonable.

Between 22 and 344 microseconds.

(by the way, this example app is available in the console repo)

Of course, maybe 17 seconds is just fine in your use case.

But with Tokio console, you now have that information easily available.

availability

(updated 2023-05-10)

The scheduled time feature has released!

To use it, you need at least tokio-console 0.1.8 and console-subscriber 0.1.9.

topology spread constraints and horizontal pod autoscaling

on Monday, 20 March 2023

I'm back with more gotchas involving topology spread constraints.

This post is effectively part 2 of something that was never intended to be a series.

Part 1 explored topology spread constraints and blue/green deployments.

To be really honest, both these posts should include an extra quantifiers:

"in kubernetes on statefulsets with attached persistent volumes."

But that makes the title too long, even for me.

What's wrong this time?

the setup

Let's review the setup, in case you haven't read part 1.

(it's recommended, but not required reading.)

(but if you don't know what a topology spread constraint is, then maybe read it.)

(or at least read aside: topology spread constraints.)

The app in question is powered by a statefulset.

Each pod has a persistent volume attached.

(hence the statefulset.)

This time we're talking about production.

In production, we scale the number of pods based on the CPU usage of our web server container.

This is known as horizontal pod autoscaling.

aside: horizontal pod autoscaling

We're going to use kubernetes terminology.

In kubernetes a pod is the minimum scaling factor.

If you're coming from standard cloud world, it's sort of equivalent to an instance.

(but with containers and stuff.)

If you're coming from a data center world (on- or off-site) then it's a server.

(but with virtualization and stuff.)

Traditionally you can scale an application in 2 directions.

Vertically and horizontally.

Vertical scaling means making the pods bigger.

More CPU.

More Memory.

That sort of thing.

Horizontal scaling means adding more pods.

Kubernetes has built in primitives for horizontal pod autoscaling.

The idea is that you measure some metric from each pod, averaged across all pods.

(or more than one, but we won't go into that.)

And then you give Kubernetes a target value for that metric.

Kubernetes will then add and remove pods (according to yet more rules) to meet the target value.

Let's imagine we are scaling on pod CPU.

We have two pods and together their average CPU is well over the target.

Two pods shown with their CPU usage as a bar graph. The target value is shown as a horizontal line. The average of the two pods is shown as another horizontal line which is significantly above the target line.

As the average is significantly above the target, Kubernetes will scale up.

Now we have 3 pods, each with less CPU than before.

Three pods shown with their CPU usage as a bar graph. The target value is shown as a horizontal line. The average of the three pods is shown as another horizontal line which is now below the target line.

The average of the CPU usage of the 3 pods is now a little less than the target.

This is enough to make the horizontal pod autoscaler happy.

Of course, all this assumes that your CPU scales per request and that more pods means fewer requests per pod.

Otherwise, this is a poor metric to scale on.

the problem

We previously had issues with pods in pending state for a long time (see part 1).

So we added monitoring for that!

Specifically an alarm when a pod had been in pending state for 30 minutes or more.

This is much longer than it should be for pods that start up in 8 - 10 minutes.

The new alert got deployed on Friday afternoon.

(Yes, we deploy on Fridays, it's just a day.)

And then the alert was triggering all weekend.

First reaction was to ask how we could improve the alert.

Then we looked into the panel driving the alerts.

There were pods in pending state for 40 minutes.

50 minutes.

65 minutes!

What was going on?

the investigation

Looking at the metrics, we saw a pattern emerging.

A single pod was in pending state for a long period.

Then another pod went into pending state.

Shortly afterwards, both pods were ready.

It looked like the following.

A time/status chart showing pending and ready states (or inactive) for 4 pods. The first 2 pods are ready for the whole time period. The 3rd pod goes into pending for a long time. Then the 4th pod goes into pending, followed shortly by the 3rd pod becoming ready and then the 4th pod becoming ready as well.

(Actually the panel didn't look like that at all.)

(What we have available is somewhat more obtuse.)

(But that is how I wish the panel looked.)

This same pattern appeared several times in the space of a few hours.

Oh right, of course.

It's the topology spread constraints again.

It all has to do with how a statefulset is scheduled.

aside: pod management policy

The pod management policy determines how statefulset pods are scheduled.

It has 2 possible values.

The default is OrderedReady.

This means that each pod waits for all previous pods to be scheduled before it gets scheduled.

A time/status chart showing pending and ready states for 4 pods, numbered 0 to 3. Pod-0 starts in pending and then moves to ready. Each subsequent pod starts pending when the preceding pod is ready, then moves to ready itself some time later.

The other options is Parallel.

In this case, pods are all scheduled together.

A time/status chart showing pending and ready states for 4 pods, numbered 0 to 3. All pods start in pending and then move to ready at more or less the same time.

That's like a deployment.

Some applications require the ordering guarantees of OrderedReady.

However, it makes deployment N times slower if you have N pods.

We have no need of those ordering guarantees.

So we use the Parallel pod management policy.

the answer

Now that we have all the context, let's look at what happens.

Let's start a new statefulset with 4 pods.

We set the maximum skew on our zone topology spread constraints to 1.

At most we can have a difference of 1 between the number of pods in zones.

Our 4 pods are distributed as evenly as possible across our 3 zones.

Three zones containing 4 pods, each pod has a volume with the same index as the pod. Zone A contains pod-0/vol-0 and pod-2/vol-2. Zone B contains pod-1/vol-1. Zone C contains pod-3/vol-3.

So far, so good.

We don't have so much load right now, so let's scale down to 2 pods.

Three zones containing 2 pods, each pod has a volume with the same index as the pod. There are 2 additional volumes without pods. Zone A contains pod-0/vol-0 and vol-2 without a pod. Zone B contains pod-1/vol-2. Zone C contains vol-3 without a pod.

After scaling down, we don't remove the volumes.

The volumes are relatively expensive to set up.

The 8 - 10 minutes that pods take to start is mostly preparing the volume.

Downloading data, warming up the on-disk cache.

A pod with a pre-existing volume starts in 1 - 2 minutes instead.

So it's important to keep those volumes.

Now let's suppose that the load on our stateful set has increased.

We need to add another pod.

So let's scale one up.

Three zones containing 2 pods which are ready and 1 which is pending, each pod has a volume with the same index as the pod. There is 1 additional volumes without a pod. Zone A contains pod-0/vol-0 and pod-2/vol-2, but pod-2 can't be scheduled and is in pending state. Zone B contains pod-1/vol-2. Zone C contains vol-3 without a pod.

Now we hit our problem.

The next pod, pod-2, has a pre-existing volume in Zone A.

But if a new pod is scheduled in Zone A, we'll have 2 pods in Zone A.

And no pods in Zone C.

That's a skew of 2, greater than our maximum of 1.

So the scheduler basically waits for a miracle.

It knows that it can't schedule pod-2 because it would breach the topology spread constraints.

And it can't schedule a pod in Zones B or C because vol-2 can't be attached.

So it gives up and tries again later.

And fails.

And gives up and tries again later.

And fails.

And this would go on until the end of time.

Except just then, a miracle occurs.

The load on our stateful set increases even more.

We need another pod!

Now we can schedule pod-3 in Zone C.

And schedule pod-2 in Zone A.

(where we've been trying to schedule it for what feels like aeons.)

And our skew is 1!

Three zones containing 2 pods which are ready and 2 which can now move to ready, each pod has a volume with the same index as the pod. Zone A contains pod-0/vol-0 and pod-2/vol-2, the latter has just been successfully scheduled. Zone B contains pod-1/vol-2. Zone C contains pod-3/vol-3 which has just been successfully scheduled.

And this is why we saw a single pod pending for a long time.

And then 2 pods go ready in quick succession.

the solution

Unfortunately I don't have such a happy ending as in part 1.

The solution is to use the OrderedReady pod management policy.

But that's impractical due to the long per-pod start up time.

So the solution is to loosen the constraint.

Allow the topology spread constraints to be best effort, rather than strict.

the ideal solution

Ideally, I want a new pod management policy.

I'd call it OrderedScheduled.

Each pod would be begin scheduling as soon as the previous pod was scheduled.

A time/status chart showing pending and ready states for 4 pods, numbered 0 to 3. Pod-0 starts in pending and then moves to ready. Each subsequent pod starts pending shortly after the preceding pod starts pending, then moves to ready itself some time later. All the pods will coincide in pending state.

That way, pods are scheduled in order.

So scaling up and down won't breach the topology spread constraints.

Of course, this is just an idea.

There are probably many sides that I haven't considered.

topology spread constraints and blue/green deployments

on Saturday, 25 February 2023

This week I discovered a flaw in our topology spread constraints.

It’s weird enough (or at least interesting enough) that I think it’s worth sharing.

This is kubernetes by the way.

And I'm talking about the topologySpreadConstraints field.

(Did you know that k8s is just counting the 8 missing letters between the k and the s.)

(I didn’t until I’d been using k8s in production for 2 years already.)

the setup

The app in question is powered by a statefulset.

Each pod has a persistent volume attached.

(Hence the statefulset.)

In our staging environment, we only run 2 pods.

Request volume is minimal and there’s no need to burn cash.

the problem

Since the day before, around 19:00, one of the two pods was always in state Pending.

It couldn’t be created due to a bunch of taint violations and other stuff.

Normal   NotTriggerScaleUp  4m38s (x590 over 109m)  cluster-autoscaler  (combined from similar events): pod didn't trigger scale-up: 1 in backoff after failed scale-up, 6 node(s) had taint {workload: always-on}, that the pod didn't tolerate, 3 node(s) had taint {workload: mog-gpu}, that the pod didn't tolerate, 3 node(s) had taint {workload: mog}, that the pod didn't tolerate, 3 node(s) had taint {workload: default-arm}, that the pod didn't tolerate, 3 node(s) had taint {workload: nvidia-gpu}, that the pod didn't tolerate, 4 node(s) had volume node affinity conflict, 1 node(s) didn't match pod topology spread constraints, 3 node(s) had taint {workload: prometheus}, that the pod didn't tolerate 

(That "code block" is big, you might have to scroll for a while to see the end.)

I don’t fully understand what all the other stuff is, I’m a kubernetes user, not an administrator.

The staging cluster runs on spot instances.

Permanently having one pod Pending, we sometimes had the other pod evicted.

This left us with zero pods.

Zero pods is bad for availability.

Our on-call engineer got woken up at 04:00.

They then got woken up again at 09:00.

Because they’d already been woken up at 04:00, so they were trying to sleep in.

Being woken up in the middle of the night for the staging environment is actually the bigger problem here.

But it’s not the interesting problem.

The interesting problem is why only one of two pods could be started.

the investigation

Here we get into the good stuff.

I asked our platform team why one of our pods was always in pending state.

They discovered that it was because the 2 persistent volumes were in the same availability zone.

This is in violation of the topology spread constraints that we had specified.

That's this part of the NotTriggerScaleUp message:

1 node(s) didn't match pod topology spread constraints

aside: topology spread constraints

Topology spread constraints are the current best way to control where your pods are allocated.

Stable in kubernetes 1.24.

(I think, please tell me if this is wrong, couldn't find better information.)

This is better than pod affinity and anti-affinity rules which were already available.

A topology spread constraint allows you to say things like:

"I want my pods to be spread across all availability zones equally."

That phrase isn't precise enough, we need to work on it.

"I want my pods to be spread across all availability zones equally."

To properly define my pods we use labels.

So, my pods would actually be, all the pods with the label app=my_app.

Or you can use multiple labels.

Equally is not always possible.

Instead, I'll ask for a maximum skew=1.

The skew is the difference between the availability zone with least pods and the one with most.

If I have 5 pods I they could be allocated as A: 1, B: 2, C: 2.

Example of 4 pods allocated across three zones. 1 in zone A, 2 in zone B, and 2 in zone C.

Maximum number of pods per zone is 2, minimum is 1.

skew=1 (which is less than or equal to 2 - 1 = 1).

They can't be allocated as A: 1, B: 1, C: 3.

Example of 4 pods allocated across three zones. 1 in zone A, 1 in zone B, and 3 in zone C.

Then the skew is is 3 - 1 = 2.

And 2 is greater than our desired skew=1.

As well as availability zone, we could use hostname (which means node).

back to the investigation

Now we know about topology spread constraints, we can continue.

The persistent volume for each pod is created new for each deployment.

So how could both persistent volumes be in the same availability zone.

Our topology spread constraint would not have allowed it!

Then another member of the platform team asked:

"With blue/green deployments, I see a topology spread constraint that would be shared between multiple statefulsets?"

"Hm, or maybe not. Those are probably restricted to the single statefulset."

Then came the forehead slapping moment.

And I went searching in our Helm chart to confirm what I already new.

Our topology spread constraints are like the example above.

They apply to all pods with the label app=my_app.

This makes sense, as in the same namespace we have separate deployments/statefulsets.

So we have topology spread constraints for app=my_app, app=other_app, etc.

But we do blue/green deployments!

aside: blue/green deployments

Blue/green is a zero-downtime deployment technique.

You start with a single current deployment.

This is your blue deployment, all the user requests go there.

Because it's the only deployment.

Blue/green deployment step 1: 2 blue pods receiving user requests.

Now you add another deployment.

This is your green deployment, it isn't receiving any user requests yet.

Blue/green deployment step 2: 2 blue pods receiving user requests. 2 green pods not receiving user requests

Once you're happy that the new (green) deployment is healthy, switch user requests.

Now the green deployment is receiving all the user requests.

Blue/green deployment step 3: 2 blue pods not receiving user requests. 2 green pods receiving user requests

Let's assume everything is going fine.

The green deployment is handling user requests.

Now we can remove our blue deployment.

Blue/green deployment step 4a: 2 green pods receiving user requests.

However, if there is a problem, we can quickly route our user requests back to the blue deployment.

The next image is just step 2 again.

It's that easy.

Blue/green deployment step 2: 2 blue pods receiving user requests. 2 green pods not receiving user requests

Now we can safely work our what's wrong with our new (green) deployment before trying again.

the answer

A pod has to be able to attach to a persistent volume.

We use WaitForFirstConsumer volume claims, so the volume isn't created until after the pod has a node.

And the pod will be allocated so that it conforms to the topology spread constraints.

But during deployment, we have more than just the 2 pods present.

Here's what happened.

We have our current deployment (blue).

Two pods, happily obeying the topology spread constraints.

We have 3 availability zones.

This means that we must have 2 zones with a single pod each, and 1 zone without any.

Blue deployment: 1 blue pod with persistent volume in zone A, another blue pod with persistent volume in zone B. There is nothing in zone C.

Now we add two pods from our new deployment (green).

All pods have the label app=my_app.

So the topology constraints apply to the pods from both deployments together.

This means that we must have 2 zones with a single pod each, and 1 zone with 2 pods.

Which is perfectly legal under our topology spread constraints.

Blue and green deployments: 1 blue pod with persistent volume in zone A, another blue pod with persistent volume in zone B. 2 green pods with respective persistent volumes in zone C.

Then we finish our deployment.

The new deployment (green) becomes the current one.

The previously current deployment is removed.

Leaving us with two pods in a single zone.

Green deployment: 2 green pods with respective persistent volumes in zone C. There is nothing in zones A and B.

This is all fine, until a pod gets evicted.

Our staging cluster runs on spot instances.

So pods get evicted a lot.

This is great to find latent availability problems with your deployments.

Which is how we got here in the first place.

If a pod gets evicted, the volume stays in the same zone.

Green deployment: 1 green pod with persistent volume in zone C, another orphaned persistent volume in zone C without a pod. There is nothing in zones A and B.

Now kubernetes tries to schedule the pod.

It has to go in the zone with the volume it needs to attach to.

That's what this part of the NotTriggerScaleUp message means:

4 node(s) had volume node affinity conflict

But it can't, because we already have the only pod in that zone.

So our current skew is 1 - 0 = 1.

If we put another pod in that zone, our skew will become 2 - 0 = 2.

And a skew of 2 isn't allowed!

the fix

The fix is relatively simple.

Each pod already has a label with the deployment identifier in it, release=depl-123.

So we include this in our topology spread constraints.

Then it will apply to all pods that match both labels app=my_app,release=depl-123.

And the topology spread constraints will only apply to pods across a single deployment.

The point at which both blue and green deployments are active could occupying only zones A and B.

Blue and green deployments: 1 blue pod with persistent volume in zone A, another blue pod with persistent volume in zone B. 1 green pod with persistent volume in zone A, another green pod with persistent volume in zone B. Zone C is empty.

Now we remove the blue deployment.

And the green deployment still adheres to the topology spread constraints.

Green deployment: 1 green pod with persistent volume in zone A, another green pod with persistent volume in zone B. Zone C is empty.

We've solved another hairy problem.

Improving the sleep cycle of our on-call engineer.

track caller

on Sunday, 29 January 2023

I've recently contributed a little bit to the Tokio project.

The first issue I worked on was #4413: polish: add #[track_caller] to functions that can panic.

Now I'm going to tell you everything you didn't know that you didn't need to know about #[track_caller].

what

Before Rust 1.42.0 errors messages from calling unwrap() weren't very useful.

You would get something like this:

thread 'main' panicked at 'called `Option::unwrap()` on a `None` value', /.../src/libcore/macros/mod.rs:15:40

This tells you nothing about where unwrap panicked.

This was improved for Option::unwrap() and Result::unwrap()in Rust 1.42.0.

More interestingly, the mechanism to do this was stabilised in Rust 1.46.0.

What was this mechanism? The track_caller attribute.

how

Where would you use #[track_caller]?

Imagine you're writing a library, it's called track_caller_demo.

Here's the whole thing:

/// This function will return non-zero values passed to it.
/// 
/// ### Panics
/// 
/// This function will panic if the value passed is zero.
pub fn do_not_call_with_zero(val: u64) -> u64 {
    if val == 0 {
        panic!("We told you not to do that");
    }

    val
}

We have been quite clear - you MUST NOT pass zero to this function.

Now along comes a user of your crate and writes this code:

use track_caller_demo::do_not_call_with_zero;

fn code_written_by_crate_user() {
    do_not_call_with_zero(0);
}

When the user runs their code, they'll see the following:

thread 'main' panicked at 'We told you not to do that', .cargo/registry/src/github.com-1ecc6299db9ec823/track_caller_demo-0.1.0/src/lib.rs:8:9

And the user says, "the crate author wrote buggy code!"

But we told them not to pass zero to that function.

We did it in multiples ways.

We don't want the user to see where the code panicked in our crate.

We want to show them their mistake.

So we annotate our function with #[track_caller]:

/// This function will return non-zero values passed to it.
/// 
/// ### Panics
/// 
/// This function will panic if the value passed is zero.
#[track_caller]
pub fn do_not_call_with_zero(val: u64) -> u64 {
    if val == 0 {
        panic!("We told you not to do that");
    }

    val
}

Now the user will see the following error message instead:

thread 'main' panicked at 'We told you not to do that', src/bin/zero.rs:4:5

This shows the location in the user's code where they called our library incorrectly.

Success!

except

There is one caveat.

The track_caller attribute must be on the whole call stack.

Every function from the panic, upwards.

Otherwise it won't work.

Let's add a new function to our library:

/// This function will return non-one values passed to it.
/// 
/// ### Panics
/// 
/// This function will panic if the value passed is one.
#[track_caller]
pub fn do_not_call_with_one(val: u64) -> u64 {
    panic_on_bad_value(val, 1);

    val
}

fn panic_on_bad_value(val: u64, bad: u64) {
    if val == bad {
        panic!("We told you not to provide bad value: {}", bad);
    }
}

We annotate our public function with #[track_caller].

Let's check the output:

thread 'main' panicked at 'We told you not to do that', .cargo/registry/src/github.com-1ecc6299db9ec823/track_caller_demo-0.1.0/src/lib.rs:29:9

The panic is pointing at our perfectly good library code!

To make this work, annotate the whole stack:

/// This function will return non-one values passed to it.
/// 
/// ### Panics
/// 
/// This function will panic if the value passed is one.
#[track_caller]
pub fn do_not_call_with_one(val: u64) -> u64 {
    panic_on_bad_value(val, 1);

    val
}

#[track_caller]
fn panic_on_bad_value(val: u64, bad: u64) {
    if val == bad {
        panic!("We told you not to provide bad value: {}", bad);
    }
}

Now we get:

thread 'main' panicked at 'We told you not to provide bad value: 1', src/bin/one.rs:4:5

Much better!

Most of the work on tokio#4413 was writing tests to ensure this didn't happen.

except except

OK, there's another caveat.

The track_caller attribute doesn't work in some places.

It doesn't work on closures (rust#87417).

But it does newly work on async functions (rust#78840).

Although I can't seem to work out which version of Rust that's in.

one more thing

You can also make use of #[track_caller] without a panic!

The same mechanism that panic uses to get the calling location is available for all.

It's called with std::panic::Location::caller().

This is used by the unstable tracing feature in Tokio.

It allows console to display the creation location for each task.

A simple example would be:

/// Calls (prints) the `name` together with  the calling location.
#[track_caller]
pub fn call_me(name: &str) {
    let caller = std::panic::Location::caller();

    println!(
        "Calling '{name}' from {file}:{line}",
        name = name,
        file = caller.file(),
        line = caller.line(),
    );
}

Because we're using #[track_caller], the panic location will give us where call_me was called from.

If we call it twice in succession:

fn main() {
    call_me("Baby");

    call_me("Maybe");
}

We would get the output:

Calling 'Baby' from src/bin/extra.rs:4
Calling 'Maybe' from src/bin/extra.rs:6

And this trick also works multiple layers into your call stack.

As long as you remember to annotate every function on the way down.

Which is pretty cool.

not working

on Saturday, 22 October 2022

In 2020, COVID-19 hit Europe.

But unless you're reading this in the far future, you already knew that.

Like many companies with offices in Germany, mine put many of the staff on Kurzarbeit.

Kurzarbeit means short work in German.

A company reduces the working hours of some of its staff, in my case I went to 4 days a week.

The salary is reduced proportionately, but the German government will fill some of the difference.

In my case, I didn't get a lot filled in, but it was only for 2 months.

And those 2 months were fantastic.

It happened at a fortuitous time for me.

My partner was still on parental leave after our daughter was born.

So I got 3 day weekends with my new family.

But that wasn't the best bit.

Because the German government is paying some of the employees salaries, they have certain expectations.

Employees shouldn't be working more than their (reduced) contracted hours.

Our company took this very seriously.

We had to fill in time sheets for the first time ever.

Not to ensure that we were working our hours, but to ensure that we weren't working over our hours.

And no moving hours or minutes between days.

Strictly 8 hours a day, not a minute more.

We were given strict instructions to not work outside of the hours on our timesheet.

No opening any work application or anything that may be logged.

No reading email.

Definitely no responding.

No reading instant messages.

Definitely no responding.

No logging onto the VPN, which meant we couldn't do anything else anyway.

And then the entire international company was informed.

Staff in Germany cannot respond to communication outside work hours.

Not in the evening, not on the weekend, not even 1 minute after the timesheet said that they stopped working.

Not working outside work hours wasn't the best part of those 2 months of Kurzarbeit.

It was the expectation by the rest of the organization that I wouldn't be working.

If there's one thing you can instill in your organization's culture that will greatly improve employee life, it's that.

Expected that employees aren't working outside their working hours.

initial commit

on Wednesday, 10 August 2022

The first post on hēg denu.

Here's some code to look at.

#!/usr/bin/perl
chop($_=<>);@s=split/ /;foreach$m(@s){if($m=='*'){$z=pop@t;$x=
pop@t;$a=eval"$x$m$z";push@t,$a;}else{push@t,$m;}}print"$a\n";