You've reached the end of my series on understanding async/await in Rust.
(the beginning of the end)
Throughout the last posts we've asked a series of questions.
The answers to those questions helped us understand how async/await works.
We did this by looking at how to "manually" implement futures.
(this is what the async/.await syntax hides from us)
But that syntax is really just sugar on top of implementations of the Future trait.
Everyone likes sugar, so why would we ever not want to use async/await?
(I know that not everyone likes sugar)
(this is where my analogy really falls apart)
This is our final question.
These are the questions we've asked so far.
And why would I?
Let's have a look.
why would I ever want to write a future manually?
Rust's async/await syntax allows us to easily write async code.
But this isn't the best bit.
This syntax allows us to write async code that is easy to read.
It's much easier to follow code written with async/await than the alternatives.
Let's say callbacks.
(like Javascript)
Or something even uglier like delegates from Objective-C.
(I'm going to leave this here for the curious)
But implementing the Future trait in Rust makes those patterns look welcoming!
(enough complaining now)
In reality, async/await allows you to compose futures.
These may be other async functions or blocks.
(which are just futures underneath)
These may be futures written by clever people.
(like the ones who write async runtimes)
But some things can't be done without the implementation details.
Specifically, for some things, you need access to that waker.
why we need a waker
Remember that when a future returns Poll::Pending, that will generally be propagated up to the task.
The future driving the task will return Poll::Pending.
Then the task won't be polled again immediately.
In fact, it won't be polled again at all until it gets woken.
In part 2, we built the YieldNow future.
It returns Poll::Pending, but not before waking the task.
This causes the runtime to schedule the task to be polled again as soon as possible.
This isn't a very interesting future.
(although we learned a lot from it)
An interesting future wouldn't wake the task before returning Poll::Pending.
It would wake the task at some point later when something is ready that wasn't ready immediately.
So let's build an interesting future.
an interesting future
(this is the band formed after pending future split up)
A really interesting future would deal with networking or other OS level things.
But that's beyond the level of this series of posts.
(this is a bit of a lie)
(the truth is, it's beyond me)
So let's build something that isn't too complex.
And ideally has no large dependencies.
(either knowledge or code wise)
We're going to build an async channel!
aside: channels
Channels are a form of message passing.
They are not a concept exclusive to async code or Rust.
(neither is message passing obviously)
Most channels can be thought of as a queue.
Messages go in one end and come out the other.
Channels can be classified by where the messages come from, where they go, and how they're replicated.
How many producers can put messages into the channel?
How many consumers can take messages out of the channel?
How many times does each message get delivered?
The Tokio docs have a nice description of their message passing options.
Let's quickly run through some of those channels.
We can visualize each of them.
This will help us understand what's missing.
oneshot
A oneshot channel support sending a single value from a single producer to a single consumer.
Let's look at a sequence diagram.

This diagram isn't particularly interesting.
But it forms the basis for the next ones.
The important part is that there is only one of each thing.
A single producer.
A single consumer.
And a single message.
(actually Tokio's oneshot channels can be reused, but that's not important here)
Here's the reference to the one in Tokio: tokio::sync::oneshot.
multi-producer single-consumer (mpsc)
That's what MPSC stands for!
(this acronym is often used without any description)
(now you know what it means)
These channels have multiple producers.
But just a single consumer.
And many messages can be sent across them.
Quick aside-aside.
Often we distinguish bounded from unbounded channels.
Bounded channels have a fixed size buffer.
Unbounded channels have an unlimited buffer.
(so they will keep filling up until the system runs out of memory)
We will gloss over this when discussing channels on a high level.
Let's look at how it works.

First big difference is that there are multiple producers.
(no big surprises there)
They each send some some messages to the channel.
The channel then delivers those messages to the consumer.
They are delivered in order.
(we usually say they are delivered in the order they were sent)
(it's really the order in which the channel received the messages)
(this is mostly the same thing)
The one in Tokio is tokio::sync::mpsc.
broadcast
After multi-producer single consumer channels comes...
Multi-producer multi-consumer (MPMC) channels!
(sort of)
A broadcast channel is always a multi-consumer channel.
But with something special.
All consumers receive all values.
Some broadcast channels may only allow a single producer (SPMC).
(single-producer multi-consumer)
Others allow multiple producers (MPMC).
(multi-producer multi-consumer)
But normally we reserve MPMC for a different type of channel.
For now, let's look at the sequence diagram.

Both of the receivers get the same sequence of messages.
That's the key here.
Tokio also has one: tokio::sync::broadcast.
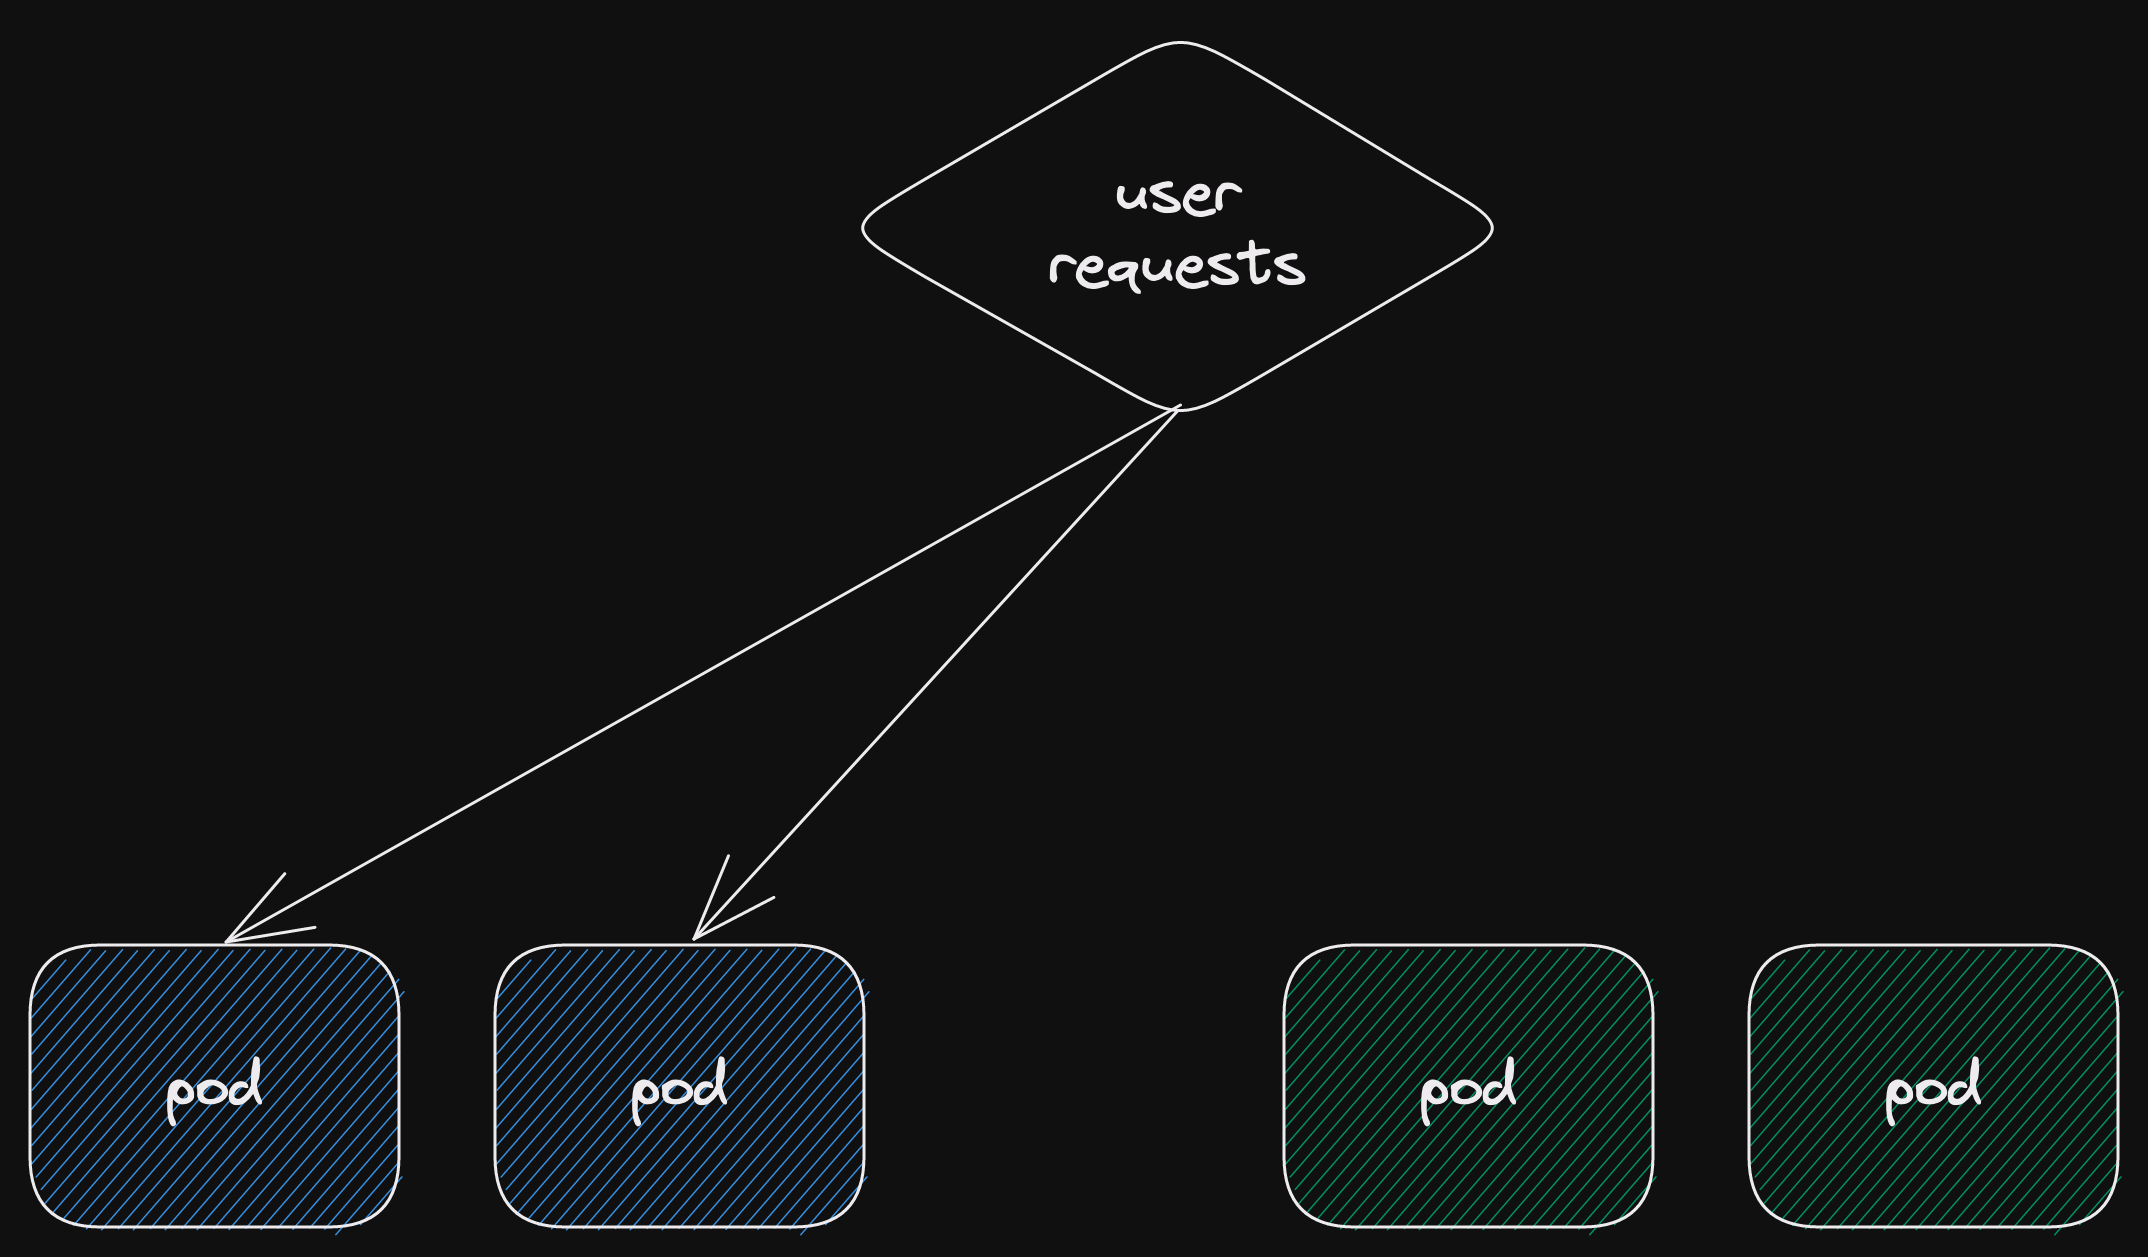
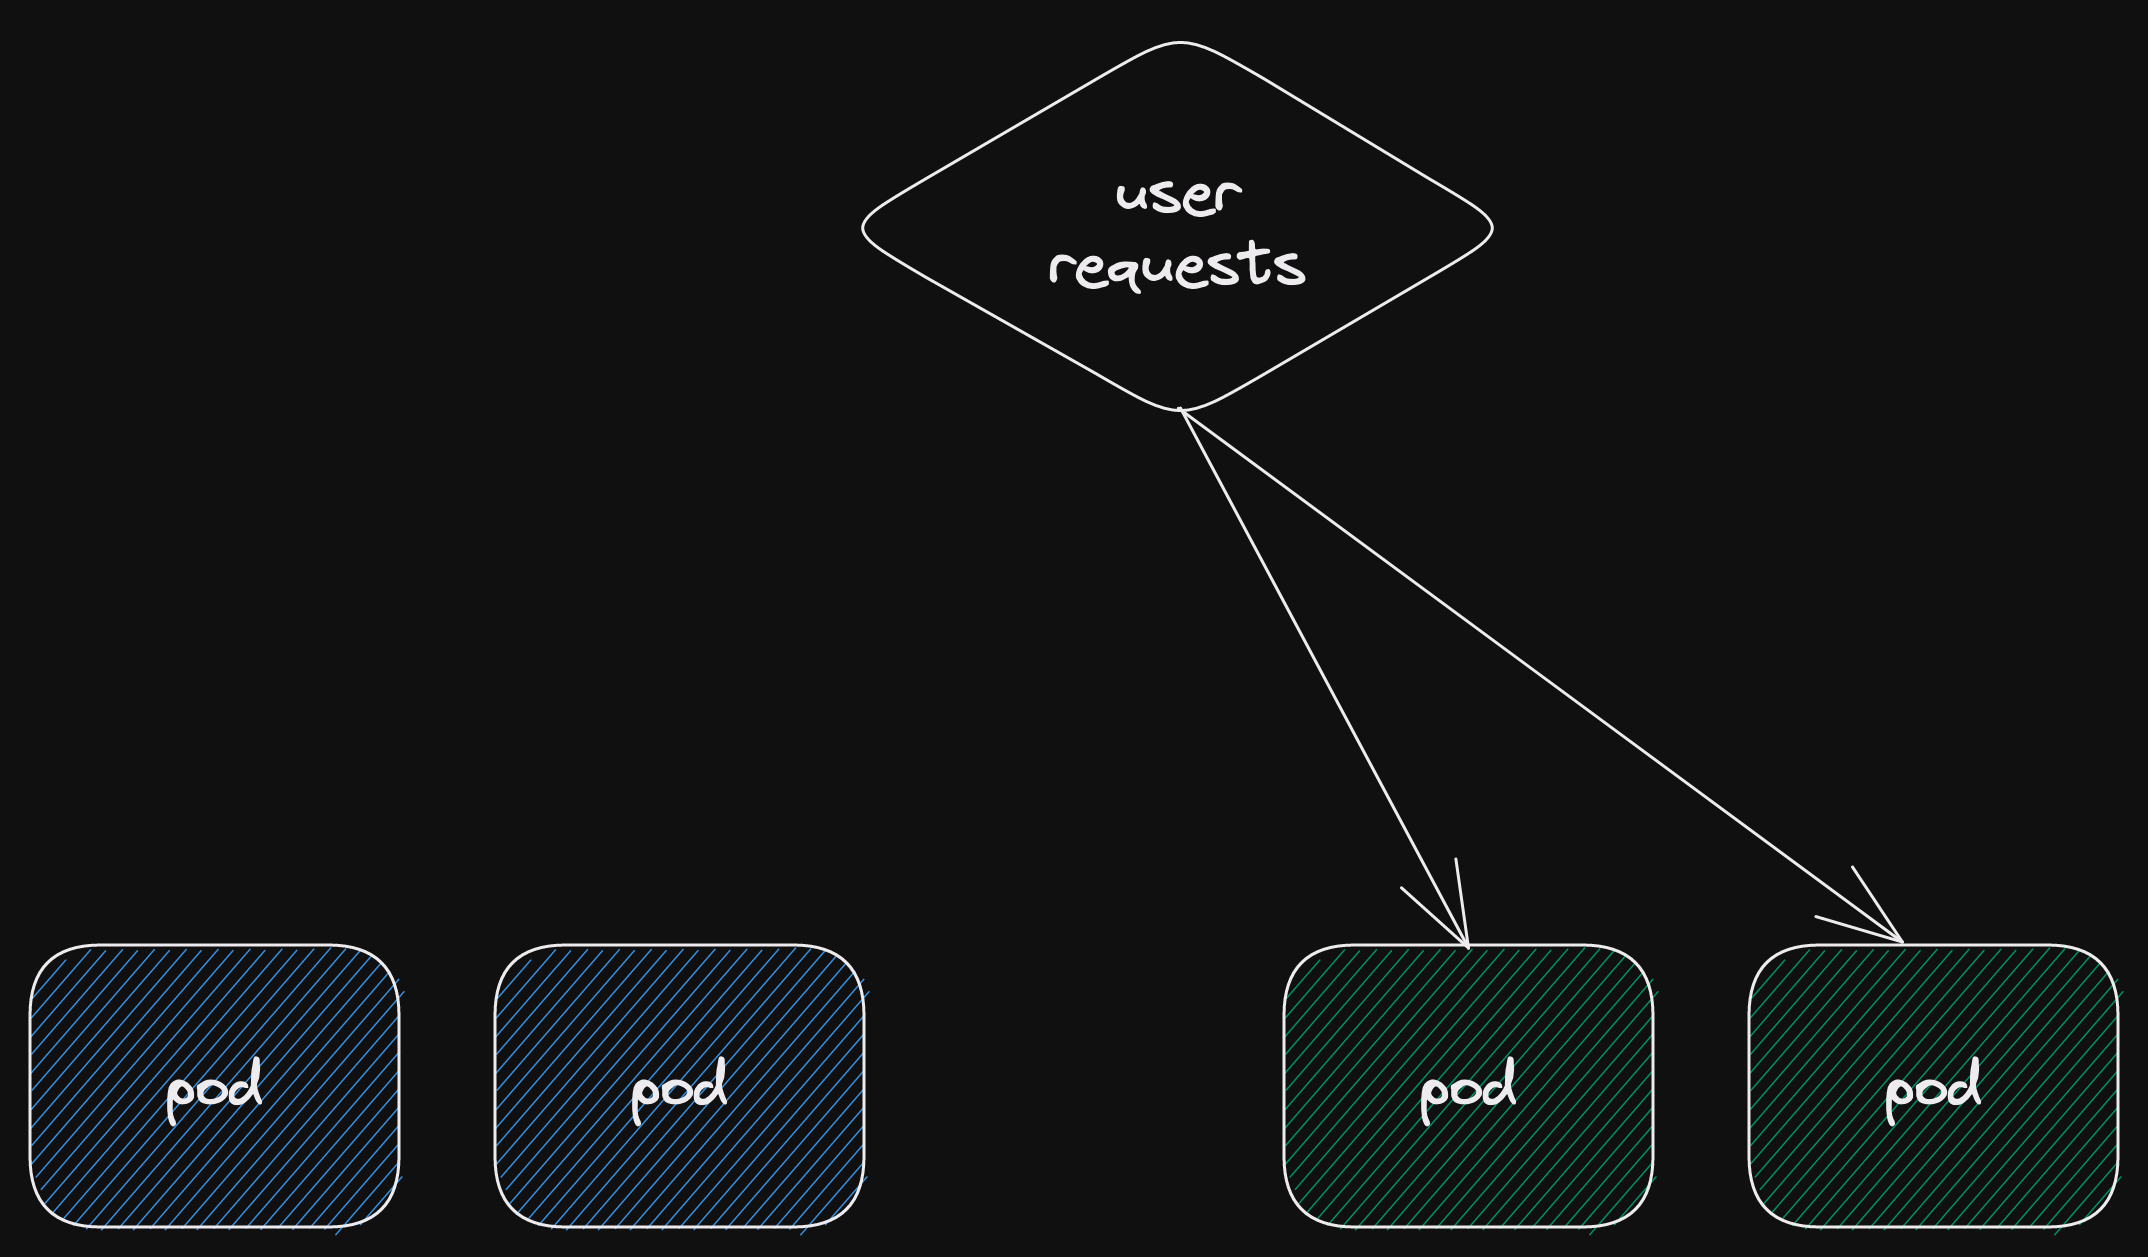
multi-producer multi-consumer (mpmc)
Another acronym that we now understand!
Multi-producer multi-consumer.
As we just saw, a broadcast channel can be a sort of MPMC channel.
The difference is that in this channel, each message will only be received by a single consumer.
This is the sort of channel you would use to distribute work a finite number of tasks.
The sequence diagram shows the difference.

Like all the channels we've seen, this channel is ordered.
The consumers receive messages in the same order they were sent.
But there is no concept of fairness amongst consumers.
The first consumer to try to receive a message gets the next message.
(we could also say that there is no load balancing)
Now, where's that link to the implementation in Tokio?
There isn't one!
Tokio doesn't have an implementation of an MPMC channel.
So let's build one!
But first, some truth telling.
aside: async-channel
There are implementations of MPMC channels available.
The async-channel crate provides one.
It's part of the smol-rs project.
Smol is another async runtime for Rust.
It's more modular than Tokio.
As a result, some parts of it can be dropped into a Tokio runtime and just work.
But we can still learn something from building our own.
So let's do that!
our own mpmc channel
We're going to write our own multi-producer multi-consumer channel.
And it's going to be simple.
(you know I'm all about simple)
Here's the complete code: understanding_async_await::mpmc.
In case you prefer having it from the beginning.
Let's begin with the API.
We'll base it on the std library and Tokio channel APIs.
channel API
Here's the signature for our channel() function.
(with rustdocs, you always include rustdocs, rigth?)
/// Creates a new asynchronous bounded multi-producer multi-consumer channel,
/// returning the sender/receiver halves.
///
/// The channel will buffer messages up to the defined capacity. Once the
/// buffer is full, attempts to send new messages will wait until a message is
/// received from the channel. When the channel is empty, attempts to receive
/// new messages will wait until a message is sent to the channel.
///
/// If all receivers or all senders have disconnected, the channel will be
/// closed. Subsequent attempts to send a message will return a
/// [`ChannelClosedError`]. Subsequent attempts to receive a message will drain
/// the channel and once it is empty, will also return a [`ChannelClosedError`].
pub fn channel(capacity: usize) -> (Sender, Receiver)
OK, so we have much more docs than function signature.
Let's break it down.
The function returns sender and receiver halves.
This is standard Rust practice for constructing a channel.
The two halves can be passed around as needed.
Independent of one another.
(we'll look at the halves shortly)
In the second paragraph, we specify that our channel will buffer messages.
So the function requires the capacity.
This means capacity messages can be sent without any being received.
Then what?
Then the channel is full.
And the senders will wait until some message is received.
(wait asynchronously of course)
On the other side, the channel might be empty.
Then the receivers will wait until some message is sent.
(yes, yes, wait asynchronously)
Finally we have a bit about closing the channel.
There are two ways the channel could get closed.
If all the receivers disconnect from the channel.
(this means all the receivers are dropped)
This means that no messages will be received.
So there's no point in sending any more.
(queue the song Unsent Letter by MGF)
So we'll alert the senders by returning an error next time a send is attempted.
The other way is if all the senders disconnect from the channel.
In this case, no new messages will be sent.
But there may be messages in the channel already.
So we'll let the receivers drain the channel.
(retrieving any messages in there)
But once the channel is empty, new receive attempts would block forever.
(I don't have a song for this one)
(really should have used Unsent Letter here instead)
Instead, trying to receive from a channel that is empty and closed will return an error.
That seems pretty clear.
Let's look at the sender and receiver halves.
One more thing.
This channel only sends Strings.
(I know this is boring)
(but let's focus on async stuff, not generics stuff)
channel halves
(I really wanted to call this section "you complete me")
First let's look at the sender.
/// The sending-half of the [`mpmc::channel`] type.
///
/// Messages can be sent through the channel with [`send`].
///
/// This half can be cloned to send from multiple tasks. Dropping all senders
/// will cause the channel to be closed.
///
/// [`mpmc::channel`]: fn@super::mpmc::channel
/// [`send`]: fn@Self::send
pub struct Sender
Nothing much new on the struct itself.
We can clone it.
(but we don't derive Clone, you'll see why later)
It can be used to send messages.
Let's have a look at that method.
impl Sender {
    /// Sends a value, waiting until there is capacity.
    ///
    /// A successful send occurs when there is at least one [`Receiver`] still
    /// connected to the channel. An `Err` result means that the value will
    /// never be received, however an `Ok` result doesn't guarantee that the
    /// value will be received as all receivers may disconnect immediately
    /// after this method returns `Ok`.
    pub async fn send(&self, value: String) -> Result<(), ChannelClosedError>
}
Remember, we're just sending strings today.
(making this channel generic is left as an exercise for the reader)
Our public API is an async function that takes the value to be sent.
It returns a result.
The result can either be Ok with the unit type ().
Or it could be our error.
There is only one possible error, that the channel is closed.
Now let's look at the receiver.
/// The receiving-half of the [`mpmc::channel`] type.
///
/// Messages can be received from the channel with [`recv`].
///
/// This half can be cloned to receive from multiple tasks. Each message will
/// only be received by a single receiver. Dropping all receivers will cause
/// the channel to be closed.
///
/// [`mpmc::channel`]: fn@super::mpmc::channel
/// [`recv`]: fn@Self::recv
pub struct Receiver
Once again, what we expect.
And again, we claim to be able to clone the receiver.
But we don't derive Clone.
We also only implement a single public (async) function on Receiver.
impl Receiver {
    /// Receives a value, waiting until one is available.
    ///
    /// Once the channel is closed (by dropping all senders), this method will
    /// continue to return the remaining values stored in the channel buffer.
    /// Once the channel is empty, this method will return
    /// [`ChannelClosedError`].
    pub async fn recv(&self) -> Result<String, ChannelClosedError>
}
Upon success, recv() will return a String.
The only error it can return is ChannelClosedError.
And this is only returned if the channel is empty.
Now we know the API we'd like to implement.
Let's look at an example sequence diagram of how it would be used.
We'll just use a single produce and single consumer to understand the async/await part better.

(code that implements this sequence can be found on GitHub: channel_halves.rs)
Our main task calls channel(1) and gets the sender and receiver back.
This is a channel with a capacity of one.
(not very big)
The receiver is sent to its own task to receive in a loop.
We now imagine that it tries once.
But the call to recv().await has to wait because the channel is empty.
Now the sender gets sent to its own task to send two values.
The first is sent.
Then it attempts to send the second value.
(we're picking our own concurrent interleaving here)
(it makes the story more interesting)
The second value can't be sent as the channel is full.
So the call to send().await waits.
Our receiver now receives a value.
As the channel now has capacity, the waiting call to send().await returns.
The sending task now completes.
This leaves our receiver.
It receives the second value.
(all good)
Then it tries to receive again.
This time it gets an Err(ChannelClosedError) back.
Since the sender was dropped, the channel is closed.
And now it's empty as well.
So our receiving loop task also completes.
With this, we have a basis for understanding how our API should work.
Time to look at implementing this async functionality.
This will involve implementing these two async functions.
Sender::send() and Receiver::recv().
To do this we will need to implement futures manually.
(that is the whole point of this series in a way)
(understanding async/await by implementing the bits under it)
So let's look at each of these async functions and the futures underneath them in turn.
inner channel
One thing, before we start implementing futures.
The senders and receivers will all share the channel.
We're going to do that the easy way.
A private struct wrapped in Arc and Mutex.
We learnt about mutexes in part 3.
(we also learnt about some things we shouldn't do with them)
(so we won't do that stuff)
Using a Mutex in this way isn't generally very efficient.
It will definitely not perform well under high load.
But it will serve to let us write our send and receive futures.
And we'll know that we won't cause any data corruption or data races.
So we'll create a Channel struct.
This won't be public.
We'll look at its implementation later.
send future
We're going to start with implementing Sender::send().
Let's look at a sequence diagram of our three different outcomes.
As we prepare to implement Future, we'll expand upon this diagram.

This diagram is on an async/await level.
The three outcomes represent three states that the channel can be in.
State: channel has capacity.
In this case, the async function returns Ok straight away.
(an async function returning straight away isn't the same as any other function returning straight away)
(it could still yield to the runtime in the meantime)
State: channel is closed.
This is a terminal state for the inner channel.
(that means it's the last state, there are no more states after it)
The async function will immediately return the channel closed error.
(same caveat on using "immediately" with "async")
State: channel is full.
In this case, the async function will wait, not return anything.
(we know there is probably a Poll::Pending needed here)
(but let's not get ahead of ourselves)
At some point, capacity will be freed
(we hope)
This would happen when a receiver receives a message.
Then the async function will return Ok as in the first case.
(since we've essentially moved to the first state)
Let's go on to implement our async function.
We won't go into the details of constructing the Sender struct.
For now, it's enough to know that Sender has a private field giving it access to the inner channel.
pub struct Sender {
    inner: Arc<Mutex<Channel>>,
}
To implement that public async function, we're going to need a Future.
We'll call our future Send.
(not very imaginative, which is probably a good thing)
(imaginative names make less sense to others)
First, here's that implementation of Sender::send().
pub async fn send(&self, value: String) -> Result<(), ChannelClosedError> {
    Send {
        value,
        inner: self.inner.clone(),
    }
    .await
}
Pretty simple, right?
We construct our Send future.
And then await it.
To be clear about the types, here is the struct definition for Send.
struct Send {
    value: String,
    inner: Arc<Mutex<Channel>>,
}
Our Send future has just one job
Send a value when the channel has capacity.
We don't even need state for this.
We will instead depend on the state of the channel.
(and we'll trust our async runtime to not poll us after we've returned Poll::Ready)
We do need the value itself.
And the Send future may outlive the Sender.
(although this isn't ideal)
So we'll take our own reference to the inner channel.
Before we look at the implementation, let's expand our sequence diagram.
We're diving through the async/await syntax and into future land.

The creation of the Send future is outside of the states.
This is because it is always the same.
As you can see, we've already created part of the API for our inner channel.
This is based purely on what we know we need.
It has a (synchronous) send() function which returns a result.
Either Ok(()) or one of 2 errors depending on whether the channel is closed or full.
The first two states are fairly straight forward.
(channel has capacity and channel is closed)
So let's look at channel is full.
In this case, Channel::send() will return an error stating that the channel is full.
Our Send future will return Poll::Pending.
But first...
We need a way to register our waker with the channel.
Then we'll expect to get woken when there is free capacity.
For this, the channel has another method, Channel::register_sender_waker().
The diagram cheats a little bit.
We know that the channel won't wake our task directly.
We'll also skip over the channel implementation.
It's enough that we have a requirement.
When we register a sender waker, the channel must wake it when there is capacity.
Of course, there may be multiple senders and they may have all registered wakers.
So we can't expect to be woken for the next free capacity.
But that's an inner channel implementation detail.
Now let's dive into the Future implementation.
impl Future for Send {
    type Output = Result<(), ChannelClosedError>;

    fn poll(self: std::pin::Pin<&mut Self>, cx: &mut std::task::Context<'_>) -> Poll<Self::Output> {
        let Ok(mut guard) = self.inner.lock() else {
            panic!("MPMC Channel has become corrupted.");
        };

        match guard.send(self.value.clone()) {
            Ok(_) => Poll::Ready(Ok(())),
            Err(ChannelSendError::Closed) => Poll::Ready(Err(ChannelClosedError {})),
            Err(ChannelSendError::Full) => {
                guard.register_sender_waker(cx.waker().clone());
                Poll::Pending
            }
        }
    }
}
The Output will be the same value that Sender::send() returns.
To begin with, we'll try to lock the mutex wrapping our inner channel.
If this returns an error, the inner channel is corrupted.
(actually, the mutex is poisoned)
(we looked a little bit at poisoning in how rust does mutexes from part 3)
In any event, we'll panic and be done with it.
Then we'll call send() on our inner channel.
We've already gone over the details of what happens here in the sequence diagram.
One implementation detail is that we clone the value to send to the inner channel.
This could be avoided.
But the implementation would be much more complex.
(it's because if the channel is full, we need our value back again)
So we'll leave it like this for now.
Tokio's channels use semaphore permits to correctly implement this without cloning.
That's the implementation of our Send future!
In the end it wasn't so scary.
We already knew what we needed to do.
Now we can look at the receive future.
Later we'll go over the implementation of the inner channel.
(that's mostly for completeness sake)
(and also because we want to cover actually using the waker that we "registered")
recv future
We've just seen the implementation for our async send function.
And the future that underpins it.
Now let's look at the async function Receiver::recv().
As you can probably imagine, this function is analogous to Sender::send() in many ways.
We'll cover the receive function in a similar amount of detail though.
Just to make sure that it is understandable.
First let's look at the sequence diagram up to the async function.

Just like the send one, this diagram is on an async/await level.
We also have three states.
But they are ever so slightly different.
State: channel has messages.
In this case, the recv async function returns Ok(msg).
Here msg is the first message in the channel.
It does this async-immediately.
(that's returning immediately in an async sense, but really could be doing anything in the meantime)
State: channel is closed and empty.
This state is similar to the closed channel state for the send function.
But with an additional condition.
The channel is closed and there are no more messages.
If there are remaining messages in the channel, the receivers will still get them.
Even if the channel is closed.
However, if the channel is closed and empty, and error is returned.
This is the same error that the sender returns if the channel is closed.
State: channel is empty (not closed).
For receiving, the "interesting" state is when the channel is empty.
So no message can be received.
The async function will wait.
It won't return.
(again, we can smell a Poll::Pending around here somewhere)
(but we can't see it yet)
At some point, a new message will be sent to the channel.
Then our async function will return Ok(msg).
The same as in state "channel has messages".
Now it's time to implement.
Here's the async function Receiver::recv().
pub async fn recv(&self) -> Result<String, ChannelClosedError> {
    Recv {
        inner: self.inner.clone(),
    }
    .await
}
We see that we need a new future.
Clearly we'll call it Recv.
Note that Receiver::recv() doesn't take any arguments.
(just &self, a reference to itself)
So the Recv future only needs the reference to the internal channel.
For completeness, here's the structure definition.
pub struct Receiver {
    inner: Arc<Mutex<Channel>>,
}
When we implemented Future for Send we didn't hold any state.
We made use of the state of the inner channel.
As we implement Future for Recv we will do the same.
But before we write any code, let's understand what we require.
Here's the sequence diagram showing the different states we have to consider.
(after pulling back the curtains to see the future underneath)
(this is another good band name)
(or a Culture ship name)
The same as the Send diagram, the creation of Recv happens outside of the state options.
As it is always the same.

We've further extended the necessary inner channel API.
We also need a Channel::recv() function.
Just like Channel::send() it can return 3 values.
If there is a message to receive, it returns Ok(msg).
And our future can return Poll::Ready with that msg.
If the channel is closed and empty, it returns Err(ChannelRecvError::Closed).
Then our future can also return Poll::Ready straight away, but this time with the closed error.
(that's Err(ChannelClosedError), same as for sending)
The interesting state is now when the channel is empty.
(empty but not closed of course)
Then we return Poll::Pending.
But first we need to register our waker.
A receiver waker needs to be woken on a different condition than a sender waker.
So we need a different API to register it.
(but we already gave this away when we called the other method Channel::register_sender_waker())
That's why we need Channel::register_receiver_waker().
We will expect a receiver waker to be woken when a new message enters the channel.
In this sequence diagram, we show the inner channel waking the consumer task.
But we know this goes through the runtime.
Even though we know everything already, let's look at the Future implementation.
impl Future for Recv {
    type Output = Result<String, ChannelClosedError>;

    fn poll(self: std::pin::Pin<&mut Self>, cx: &mut std::task::Context<'_>) -> Poll<Self::Output> {
        let Ok(mut guard) = self.inner.lock() else {
            panic!("MPMC Channel has become corrupted.");
        };

        match guard.recv() {
            Ok(value) => Poll::Ready(Ok(value)),
            Err(ChannelRecvError::Closed) => Poll::Ready(Err(ChannelClosedError {})),
            Err(ChannelRecvError::Empty) => {
                guard.register_receiver_waker(cx.waker().clone());
                Poll::Pending
            }
        }
    }
}
As with Send, the Output is the same as the return type of Receiver::recv().
We lock the mutex around the inner channel.
(and perform the same check for a poisoned mutex)
(our thread is like a food taster)
(if the mutex is poisoned, it dies to warn everyone else)
(except this may cause the whole program crash)
(which is like everyone dying)
Then we call Channel::recv().
We've gone through the three options already.
So we won't repeat ourselves.
That's it.
We've just written the second and final future we need for our async mpmc channel!
Of course, we would like to look at the inner channel in a bit more detail.
So let's do that now!
inner channel implementation
We've already defined four methods that our inner channel needs.
(I keep calling it the inner channel, but there is no outer channel struct)
(so the struct is just called Channel)
impl Channel {
    fn send(&mut self, value: String) -> Result<(), ChannelSendError>
    fn recv(&mut self) -> Result<String, ChannelRecvError>
    fn register_sender_waker(&mut self, waker: Waker)
    fn register_receiver_waker(&mut self, waker: Waker)
}
First we have sync versions of send() and recv().
They each have their own error type.
(we've seen them both already while implementing the Send and Recv futures)
And two methods to register wakers.
One for sender wakers.
And one for receiver wakers.
Now we have enough information to fill in the Channel struct.
/// The inner mpmc channel implementation.
///
/// This is a sync object. All methods return immediately.
struct Channel {
    /// The message buffer
    buffer: VecDeque<String>,
    /// The capacity of the channel, this many messages can be buffered before
    /// sending will error.
    capacity: usize,
    /// Indicates when the channel has been closed.
    closed: bool,

    /// The number of connected `Sender`s.
    senders: usize,
    /// The number of active `Receiver`s.
    receivers: usize,

    /// A queue of wakers for senders awaiting free capacity in the channel.
    sender_wakers: VecDeque<Waker>,
    /// A queue of wakers for receivers awaiting a new message in the channel.
    receiver_wakers: VecDeque<Waker>,
}
I've included rustdoc comments explaining each field.
But let's go through the groups.
We use a VecDeque as the message buffer.
We keep the total capacity of the channel separately.
(we could use the capacity on the VecDeque for this, but that seems like it might go wrong)
(basically because we don't control how that capacity value works)
We also have a boolean to track when the channel is closed.
The second group is a pair of counters.
We keep track of the number of senders and receivers.
(actually, we're going to expect the senders and receivers to keep track of themselves)
(but the counters need to be on the channel)
Then the last group are the queues of sender and receiver wakers.
These will be used to wake a sender waiting for capacity.
And wake a receiver waiting for a message.
Let's go backwards in adding our implementations.
The two register methods are easy.
impl Channel {
    /// Registers a waker to be woken when capacity is available.
    ///
    /// Senders are woken in FIFO order.
    fn register_sender_waker(&mut self, waker: Waker) {
        self.sender_wakers.push_back(waker);
    }

    /// Registers a waker to be woken when a message is available.
    ///
    /// Receivers are woken in FIFO order.
    fn register_receiver_waker(&mut self, waker: Waker) {
        self.receiver_wakers.push_back(waker);
    }}
Each method pushes the waker to the back of the queue.
That's all we need right now.
Now let's look at the implementation for the Channel::send() method.
impl Channel {
    /// Sends a message across the channel.
    ///
    /// If the message can be sent, the next receiver waker in the queue (if
    /// any) will be woken as there is now an additional message which can be
    /// received.
    ///
    /// An error will be returned if the channel is full or closed.
    fn send(&mut self, value: String) -> Result<(), ChannelSendError> {
        if self.closed {
            return Err(ChannelSendError::Closed);
        }

        if self.buffer.len() < self.capacity {
            self.buffer.push_back(value);
            self.wake_next_receiver();
            Ok(())
        } else {
            Err(ChannelSendError::Full)
        }
    }
}
We check check if the channel is closed.
That would mean returning the Closed error.
With that our of the way, we check if there is capacity.
If there is, we push the value onto the back of the buffer.
Then we wake the next receiver.
(more on this in a moment)
And return OK(()), we're finished.
If there isn't capacity, we return the Full error.
(now back to waking the next receiver)
Here's the implementation.
impl Channel {
    /// Wakes the receiver at the front of the queue.
    ///
    /// If no receiver wakers are registered, this method does nothing.
    fn wake_next_receiver(&mut self) {
        if let Some(waker) = self.receiver_wakers.pop_front() {
            waker.wake();
        }
    }
}
As you can see, we pop the next receiver waker.
If there is one, we wake it.
If there isn't one, we do nothing.
There being no receiver waker is the most common case.
(unless the channel is permanently full)
(which is not an ideal situation, but could happen)
However, we may as well try to pop the next value from the queue and use that to check if there is one.
Note that all these methods are synchronous.
And we assume that whoever is calling methods on Channel has locked its mutex.
("whoever" being the Sender, Receiver or their futures Send and Recv)
So we don't need to worry about access from multiple threads.
(again, this is multi-threaded cheating, but it allows us to focus on the Future impl)
The implementation for Channel::recv() is similarly straight forward.
impl Channel {
    /// Receives a message from the channel.
    ///
    /// If a message can be received, then the next sender waker in the queue
    /// (if any) will be woken as there is now additional free capacity to send
    /// another message.
    ///
    /// An error will be returned if the channel is empty. The error will
    /// depend on whether the channel is also closed.
    fn recv(&mut self) -> Result<String, ChannelRecvError> {
        match self.buffer.pop_front() {
            Some(value) => {
                self.wake_next_sender();
                Ok(value)
            }
            None => {
                if !self.closed {
                    Err(ChannelRecvError::Empty)
                } else {
                    Err(ChannelRecvError::Closed)
                }
            }
        }
    }
}
Here we attempt to pop a result from the buffer.
(we don't care if the channel is closed if there are still messages available)
if there is a value, we wake the next sender.
(there is now one additional capacity in the buffer)
Then return the value.
If there is no value, the buffer must be empty.
If the channel isn't closed, then we return the Empty error.
Otherwise, the channel is closed and we return the Closed error.
The sender waking method is basically the same as the receiver one.
impl Channel {
    /// Wakes the sender at the front of the queue.
    ///
    /// If no sender wakers are registered, this method does nothing.
    fn wake_next_sender(&mut self) {
        if let Some(waker) = self.sender_wakers.pop_front() {
            waker.wake();
        }
    }
}
That's the end of the implementation of the inner channel.
(almost the end)
(there's a little bit more)
What we haven't seen is how we determine that the channel is closed.
And together with that, how we determine when the channel should still be open.
We already saw on the Channel struct that we have counters for senders and receivers.
Now we need to implement the incrementing and decrementing of those counters.
counting
There are a few different places that the incrementing / decrementing logic could be placed.
For this code, I placed the incrementing in the new() method.
And the decrementing in the Drop implementation.
Let's look at the lifecycle of our channel's senders in a sequence diagram.
Note, at this point, we're only going to look at Sender.
The Receiver implementation is identical, so it makes no sense to cover it.

During initial channel creation, a Sender is created with an inner channel.
The Sender is responsible for calling Channel::inc_senders().
Now the inner channel will have a sender count of 1.
The next case is sender cloning.
(this is important to have multiple producers)
(our receivers can also be cloned in the same way, giving us multiple consumers)
(that's mpmc!)
Here we rely on Sender::new() to increment the sender count in the inner channel.
(this is why it made sense to put that logic in new())
The inner channel now has a sender count of 2.
Then we get onto the drop logic.
In Rust, the Drop trait gives structs a sort of destructor.
We don't have to call drop() explicitly.
It will be called automatically when an object goes out of scope.
So we'll use this to decrement the counter.
Imagine our cloned sender gets dropped.
The counter gets decremented.
So the inner channel's sender count is 1 again.
Nothing more is done.
Finally, the original sender is also dropped.
This time the inner channel's sender count goes to 0.
It calls Channel::close() on itself.
Inside close(), the channel will also wake any still registered wakers.
We would expect these to only be receiver wakers.
But a Send future can be sent to another task before being polled.
So it's possible that we have a sender waker registered for a Send future whose Sender has been dropped.
It's just safer to wake everything left.
This will avoid tasks that get stuck because they've lost their waker.
Let's jump into the implementation.
For the first and second phases.
(new channel and sender cloning)
We will need the implementation of new and the Clone trait.
Here they are.
impl Sender {
    fn new(inner: Arc<Mutex<Channel>>) -> Self {
        {
            match inner.lock() {
                Ok(mut guard) => guard.inc_senders(),
                Err(_) => panic!("MPMC Channel has become corrupted."),
            }
        }
        Self { inner }
    }
}
Note that new() needs to lock the mutex around the channel to get access to it.
It could be poisoned.
Which would cause us to panic.
There's a reason we don't use expect on the result of lock().
We don't want to leak our implementation in the error message.
(by implementation we mean the fact that we're using a mutex)
So it's better to match the result.
If the mutex hasn't been poisoned, we'll call Channel::inc_senders().
Clone will just pass the Arc-Mutex to new.
This is also why we can't derive Clone.
Because we need to call Sender::new().
impl Clone for Sender {
    fn clone(&self) -> Self {
        Self::new(self.inner.clone())
    }
}
To implement Drop we will also need to lock the mutex.
impl Drop for Sender {
    fn drop(&mut self) {
        match self.inner.lock() {
            Ok(mut guard) => guard.dec_senders(),
            Err(_) => panic!("MPMC Channel has become corrupted."),
        }
    }
}
As long as the mutex hasn't been poisoned, we call Channel::dec_senders().
The remaining logic is in the last few methods on Channel.
impl Channel {
    /// Increment the sender count.
    fn inc_senders(&mut self) {
        self.senders += 1;
    }

    /// Decrement the sender count.
    ///
    /// If the count reaches zero, close the channel.
    fn dec_senders(&mut self) {
        self.senders -= 1;
        if self.senders == 0 {
            self.close();
        }
    }

    /// Close the channel.
    ///
    /// All sender and receiver wakers which have been registered, but not yet
    /// woken will get woken now.
    fn close(&mut self) {
        self.closed = true;

        while let Some(waker) = self.sender_wakers.pop_front() {
            waker.wake();
        }
        while let Some(waker) = self.receiver_wakers.pop_front() {
            waker.wake();
        }
    }
}
The method inc_senders() does nothing more than increment the counter.
Whereas dec_senders() also checks for zero.
If the counter reaches zero, it closes the channel.
Finally, the close() method sets our boolean flag to true.
Then it flushes all the wakers.
Which means it pops them off their respective queues one by one.
And wakes them.
This will avoid stuck tasks.
It also avoids a nasty reference loop.
Wait.
A what?
a nasty reference loop
Our implementation contains a nasty reference loop.
This would result in a memory leak if not handled properly.
(but don't stress, it is being handled properly)
Let's explain.
Until a task completes, it is owned by the runtime.
And our task owns the future it is currently polling.
This would be the Send future for a producer task.
And our Send future has an Arc of the inner channel.
(via the mutex)
This would prevent the Arc's counter from ever going to zero.
So the wakers would never be dropped.
Which is unfortunate.
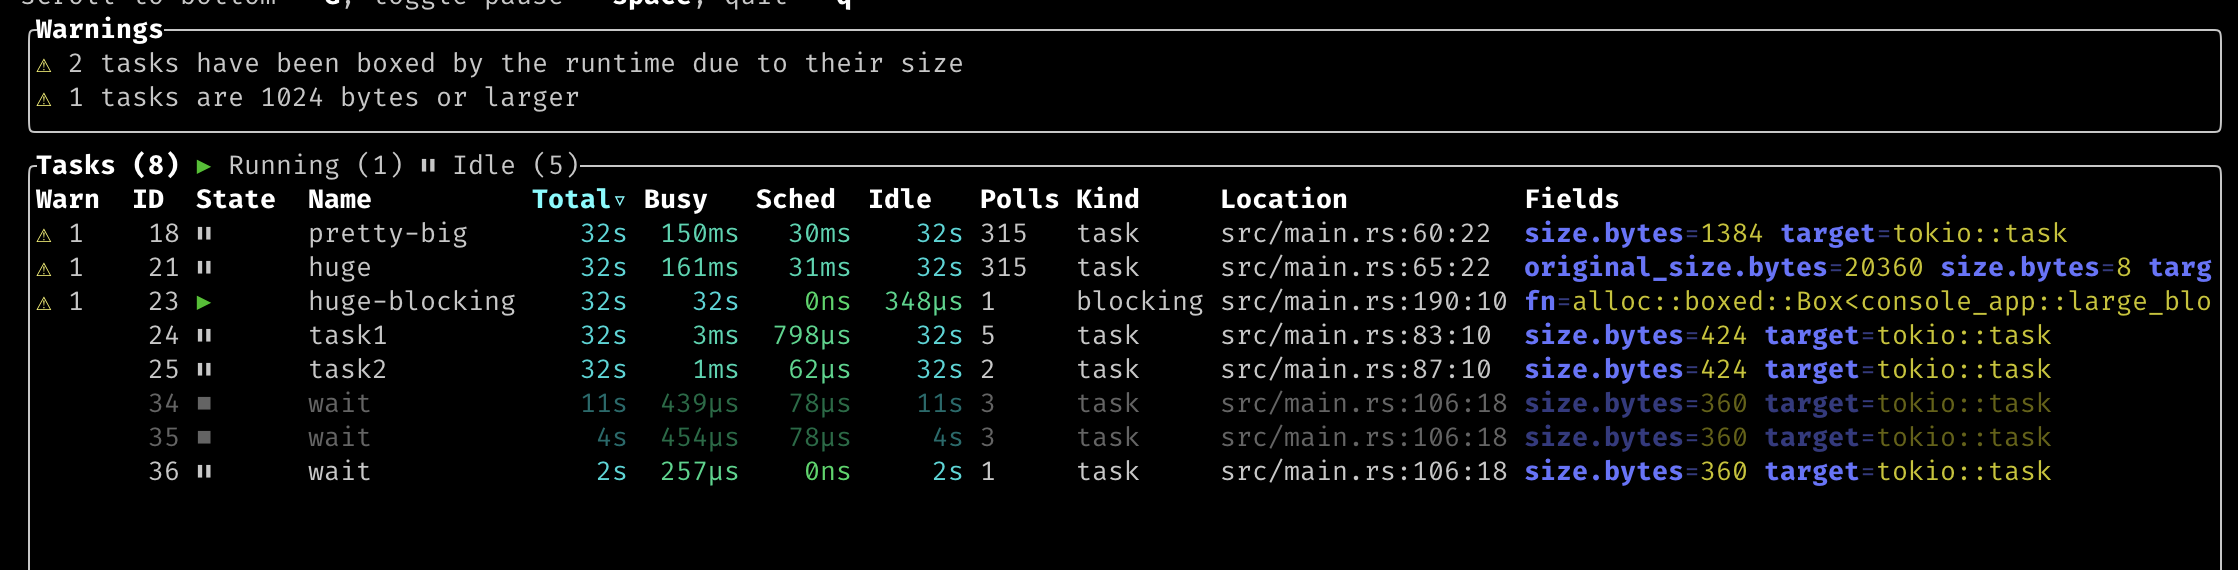
As not even Tokio Console's lost waker lint would catch that.
(since the waker count is still 1)
(console can't know that it will never be used again)
Here's a diagram of the loop.

But since we wake all the wakers upon closing the channel.
And the channel closing isn't dependent on the number of futures that may reference the inner channel.
We break the loop and everything can be freed.
As mentioned above, the receiver implementation is practically identical.
So we won't cover it here.
You can find it in the complete code though: understanding_async_await::mpmc.
There is also a small example with multiple producers and consumers: channel.
In fact, you can check out my blog repo.
And in there you can run lots of code from this series: understanding-async-await.
the end
That's the end of our async multi-producer multi-consumer channel implementation.
It's also the end of this series of blog posts.
The one on "How I finally understood async/await in Rust".
(you know you're reading a series, right?)
(no?)
(lucky you, you can start from the beginning)
During this series, we asked four questions.
Here is the abridged version.
(spoiler alert!)
Why doesn’t my task do anything if I don’t await it?
(because it returns a state machine in its initial state)
How does a pending future get woken?
(there's a thing called a waker that wakes the owning task)
Why shouldn’t I hold a mutex guard across an await point?
(because we're actually returning from a function at every await point)
Why would I ever want to write a future manually?
(because without async primitives written as "manual futures" you can't actually do anything async)
Of course the real reason for the last question was so I had an excuse to write one.
Now I've got this series out of the way.
(and the desire to write a series of blog posts out of my system)
I plan to go back to writing smaller posts on whatever I happen to be doing at the time.
thanks
Thanks to everyone for reading!
A few people wrote to me to say how much they were enjoying the series.
(and/or learning something from it)
A huge thank you to these very kind people!
That was very motivating and always made my day.
(let's be honest, it made my week, perhaps even the month)


![Sequence diagram for the Pending future, this time with the [tokio::main] macro unwrapped.](/img/understanding-async-await-2/pending-sequence_diagram-v2.svg)