topology spread constraints and horizontal pod autoscaling
by on Monday, 20 March 2023
I'm back with more gotchas involving topology spread constraints.
This post is effectively part 2 of something that was never intended to be a series.
Part 1 explored topology spread constraints and blue/green deployments.
To be really honest, both these posts should include an extra quantifiers:
"in kubernetes on statefulsets with attached persistent volumes."
But that makes the title too long, even for me.
What's wrong this time?
the setup
Let's review the setup, in case you haven't read part 1.
(it's recommended, but not required reading.)
(but if you don't know what a topology spread constraint is, then maybe read it.)
(or at least read aside: topology spread constraints.)
The app in question is powered by a statefulset.
Each pod has a persistent volume attached.
(hence the statefulset.)
This time we're talking about production.
In production, we scale the number of pods based on the CPU usage of our web server container.
This is known as horizontal pod autoscaling.
aside: horizontal pod autoscaling
We're going to use kubernetes terminology.
In kubernetes a pod is the minimum scaling factor.
If you're coming from standard cloud world, it's sort of equivalent to an instance.
(but with containers and stuff.)
If you're coming from a data center world (on- or off-site) then it's a server.
(but with virtualization and stuff.)
Traditionally you can scale an application in 2 directions.
Vertically and horizontally.
Vertical scaling means making the pods bigger.
More CPU.
More Memory.
That sort of thing.
Horizontal scaling means adding more pods.
Kubernetes has built in primitives for horizontal pod autoscaling.
The idea is that you measure some metric from each pod, averaged across all pods.
(or more than one, but we won't go into that.)
And then you give Kubernetes a target value for that metric.
Kubernetes will then add and remove pods (according to yet more rules) to meet the target value.
Let's imagine we are scaling on pod CPU.
We have two pods and together their average CPU is well over the target.
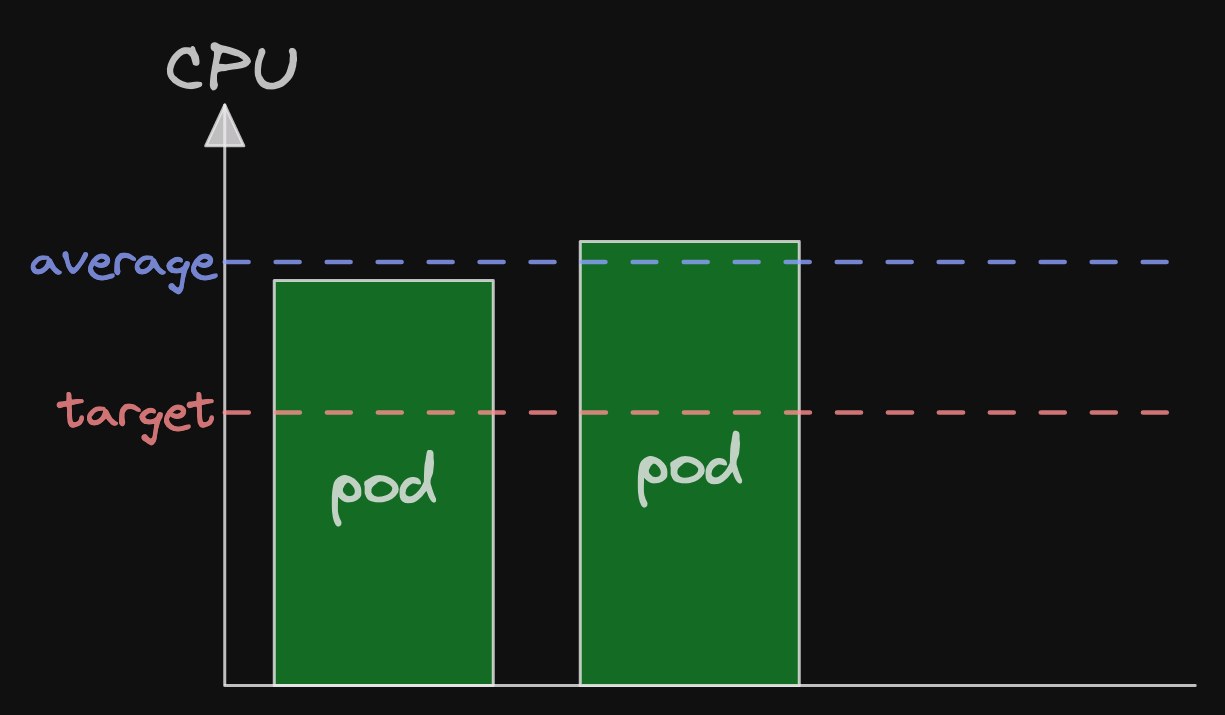
As the average is significantly above the target, Kubernetes will scale up.
Now we have 3 pods, each with less CPU than before.
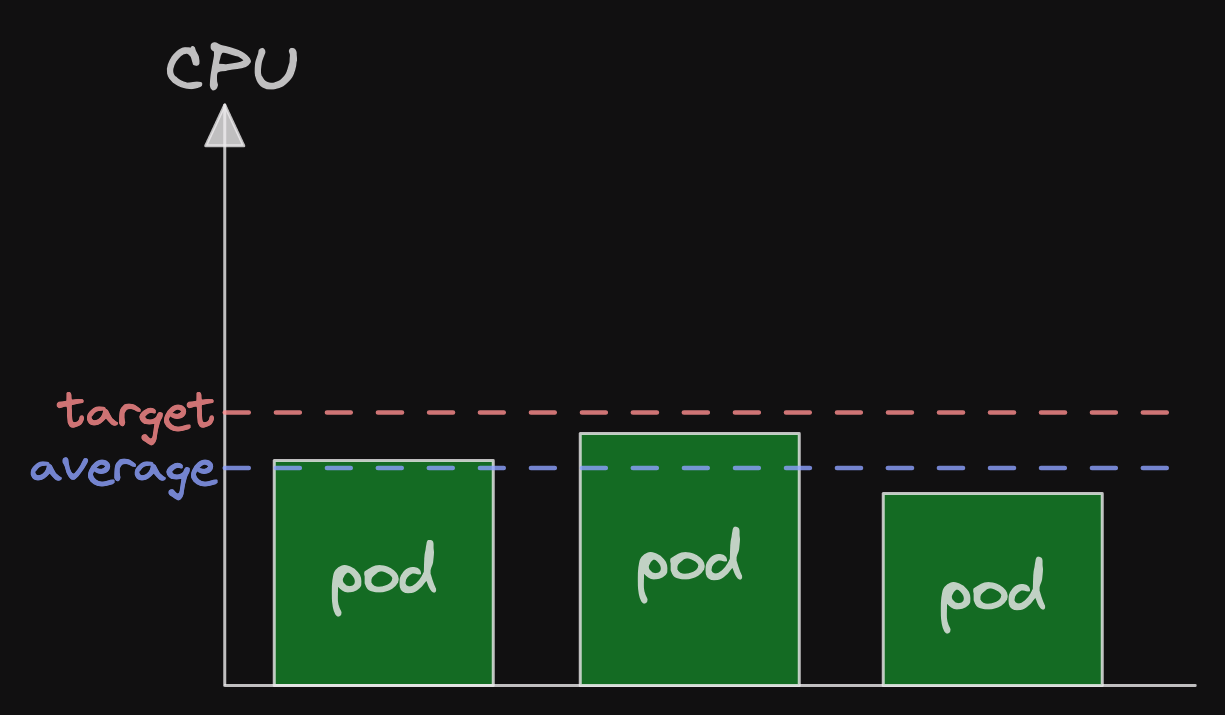
The average of the CPU usage of the 3 pods is now a little less than the target.
This is enough to make the horizontal pod autoscaler happy.
Of course, all this assumes that your CPU scales per request and that more pods means fewer requests per pod.
Otherwise, this is a poor metric to scale on.
the problem
We previously had issues with pods in pending state for a long time (see part 1).
So we added monitoring for that!
Specifically an alarm when a pod had been in pending state for 30 minutes or more.
This is much longer than it should be for pods that start up in 8 - 10 minutes.
The new alert got deployed on Friday afternoon.
(Yes, we deploy on Fridays, it's just a day.)
And then the alert was triggering all weekend.
First reaction was to ask how we could improve the alert.
Then we looked into the panel driving the alerts.
There were pods in pending state for 40 minutes.
50 minutes.
65 minutes!
What was going on?
the investigation
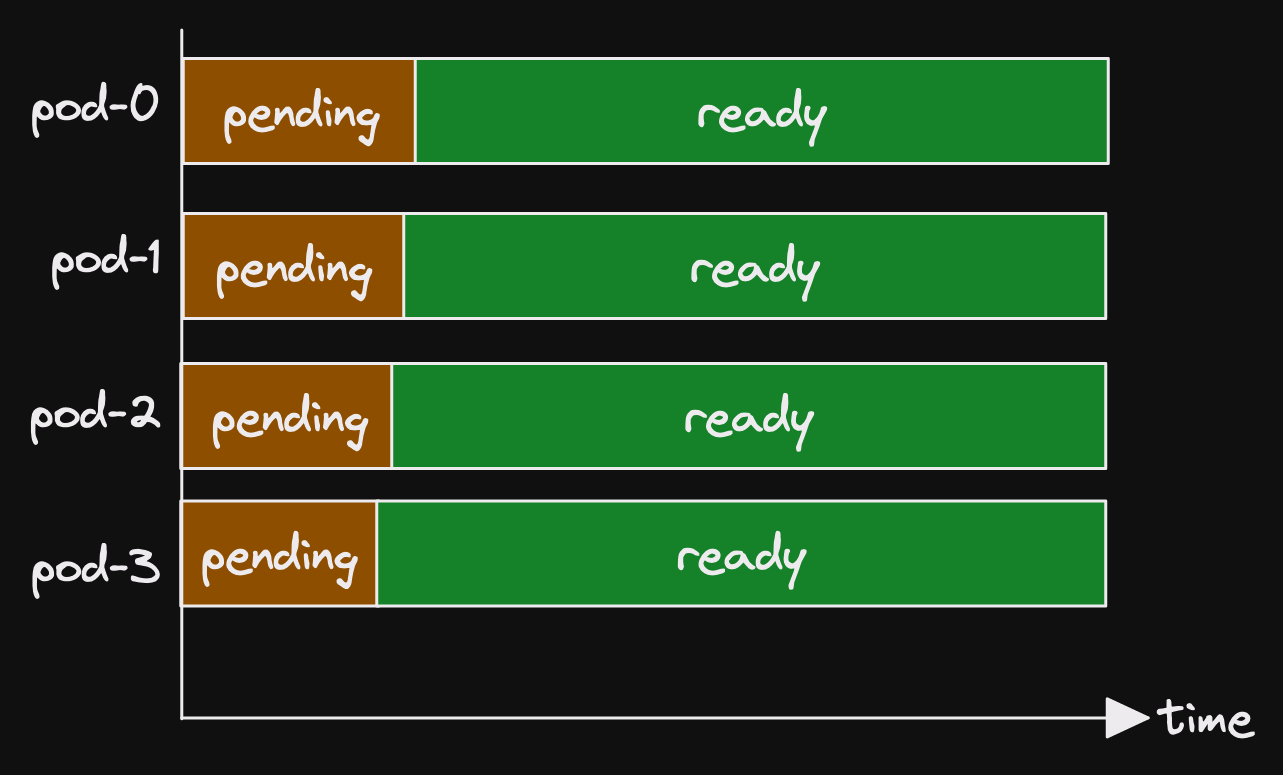
Looking at the metrics, we saw a pattern emerging.
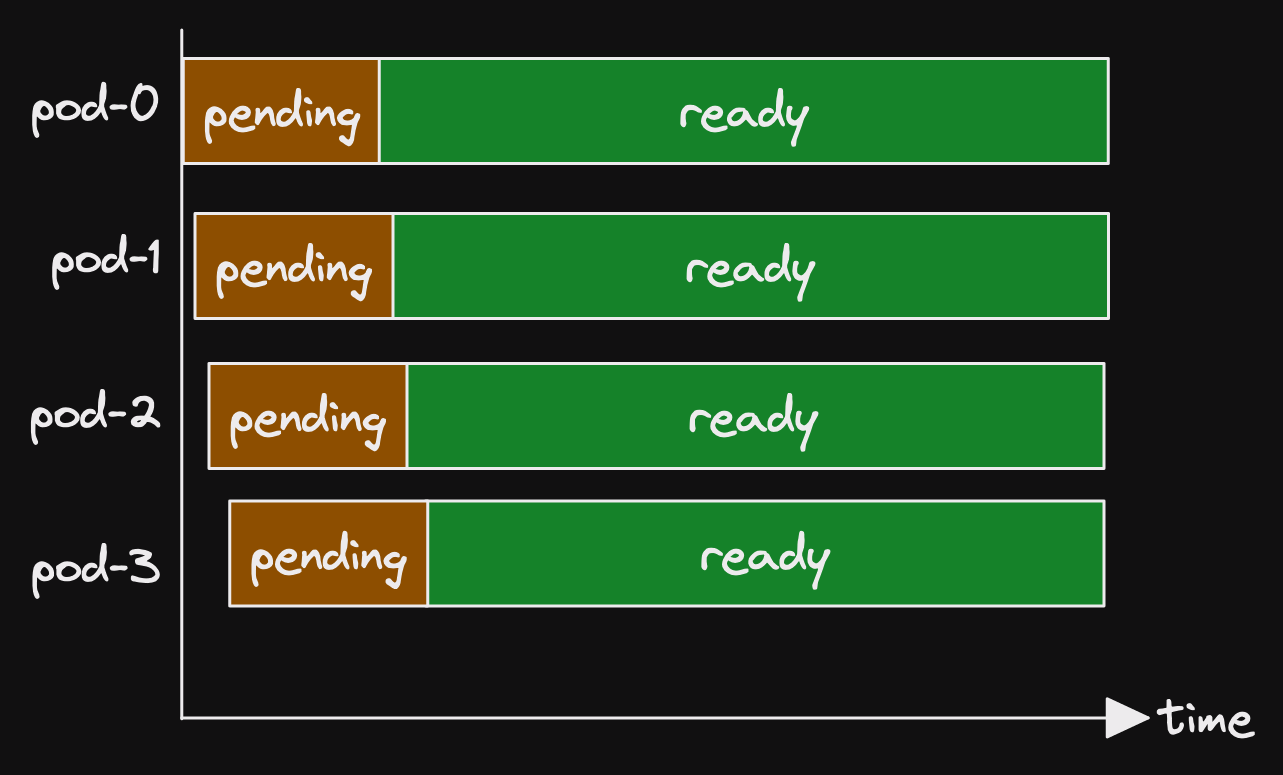
A single pod was in pending state for a long period.
Then another pod went into pending state.
Shortly afterwards, both pods were ready.
It looked like the following.
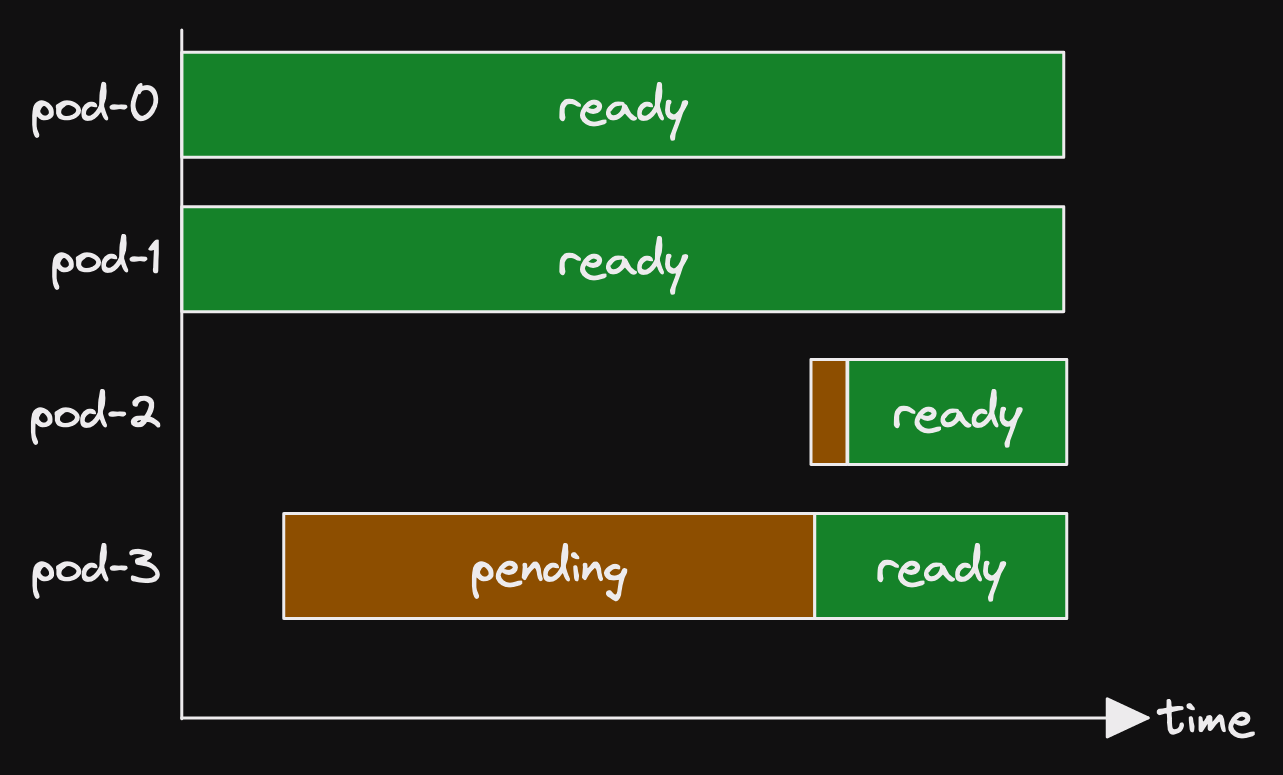
(Actually the panel didn't look like that at all.)
(What we have available is somewhat more obtuse.)
(But that is how I wish the panel looked.)
This same pattern appeared several times in the space of a few hours.
Oh right, of course.
It's the topology spread constraints again.
It all has to do with how a statefulset is scheduled.
aside: pod management policy
The pod management policy determines how statefulset pods are scheduled.
It has 2 possible values.
The default is OrderedReady.
This means that each pod waits for all previous pods to be scheduled before it gets scheduled.
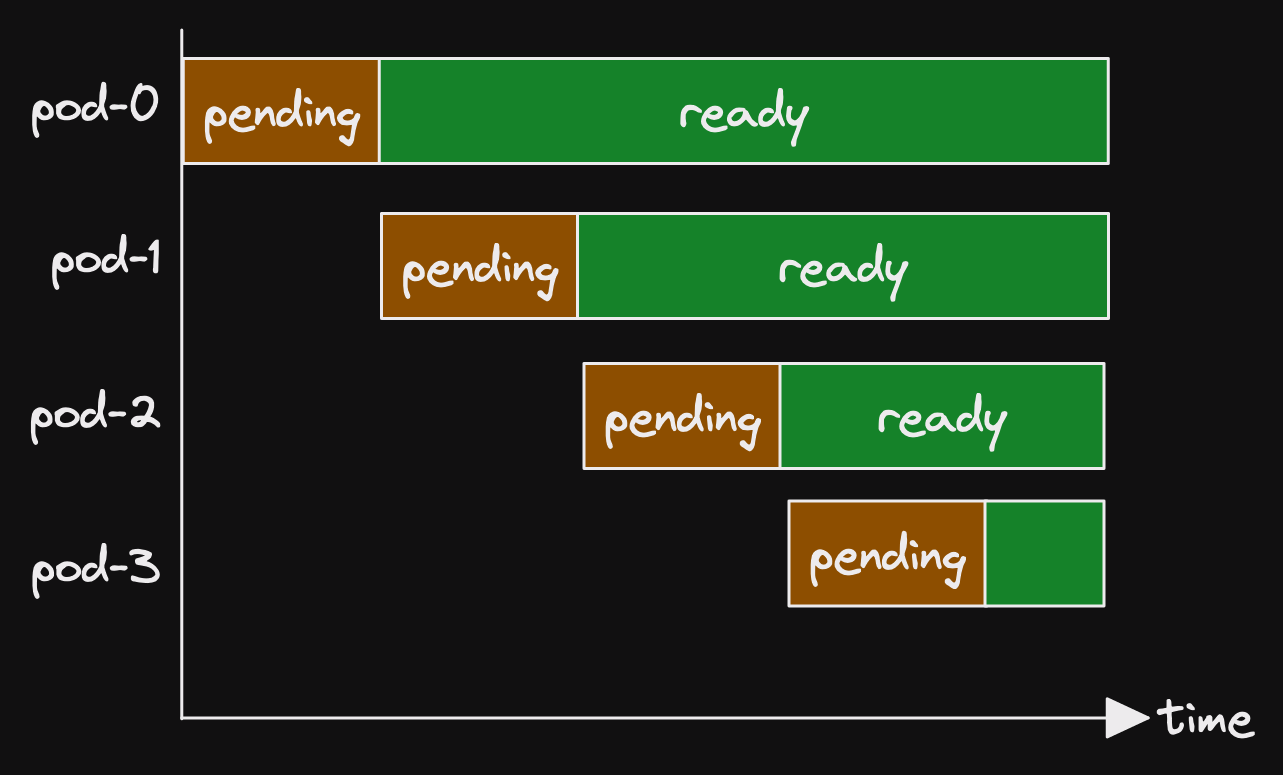
The other options is Parallel.
In this case, pods are all scheduled together.
That's like a deployment.
Some applications require the ordering guarantees of OrderedReady.
However, it makes deployment N times slower if you have N pods.
We have no need of those ordering guarantees.
So we use the Parallel pod management policy.
the answer
Now that we have all the context, let's look at what happens.
Let's start a new statefulset with 4 pods.
We set the maximum skew on our zone topology spread constraints to 1.
At most we can have a difference of 1 between the number of pods in zones.
Our 4 pods are distributed as evenly as possible across our 3 zones.
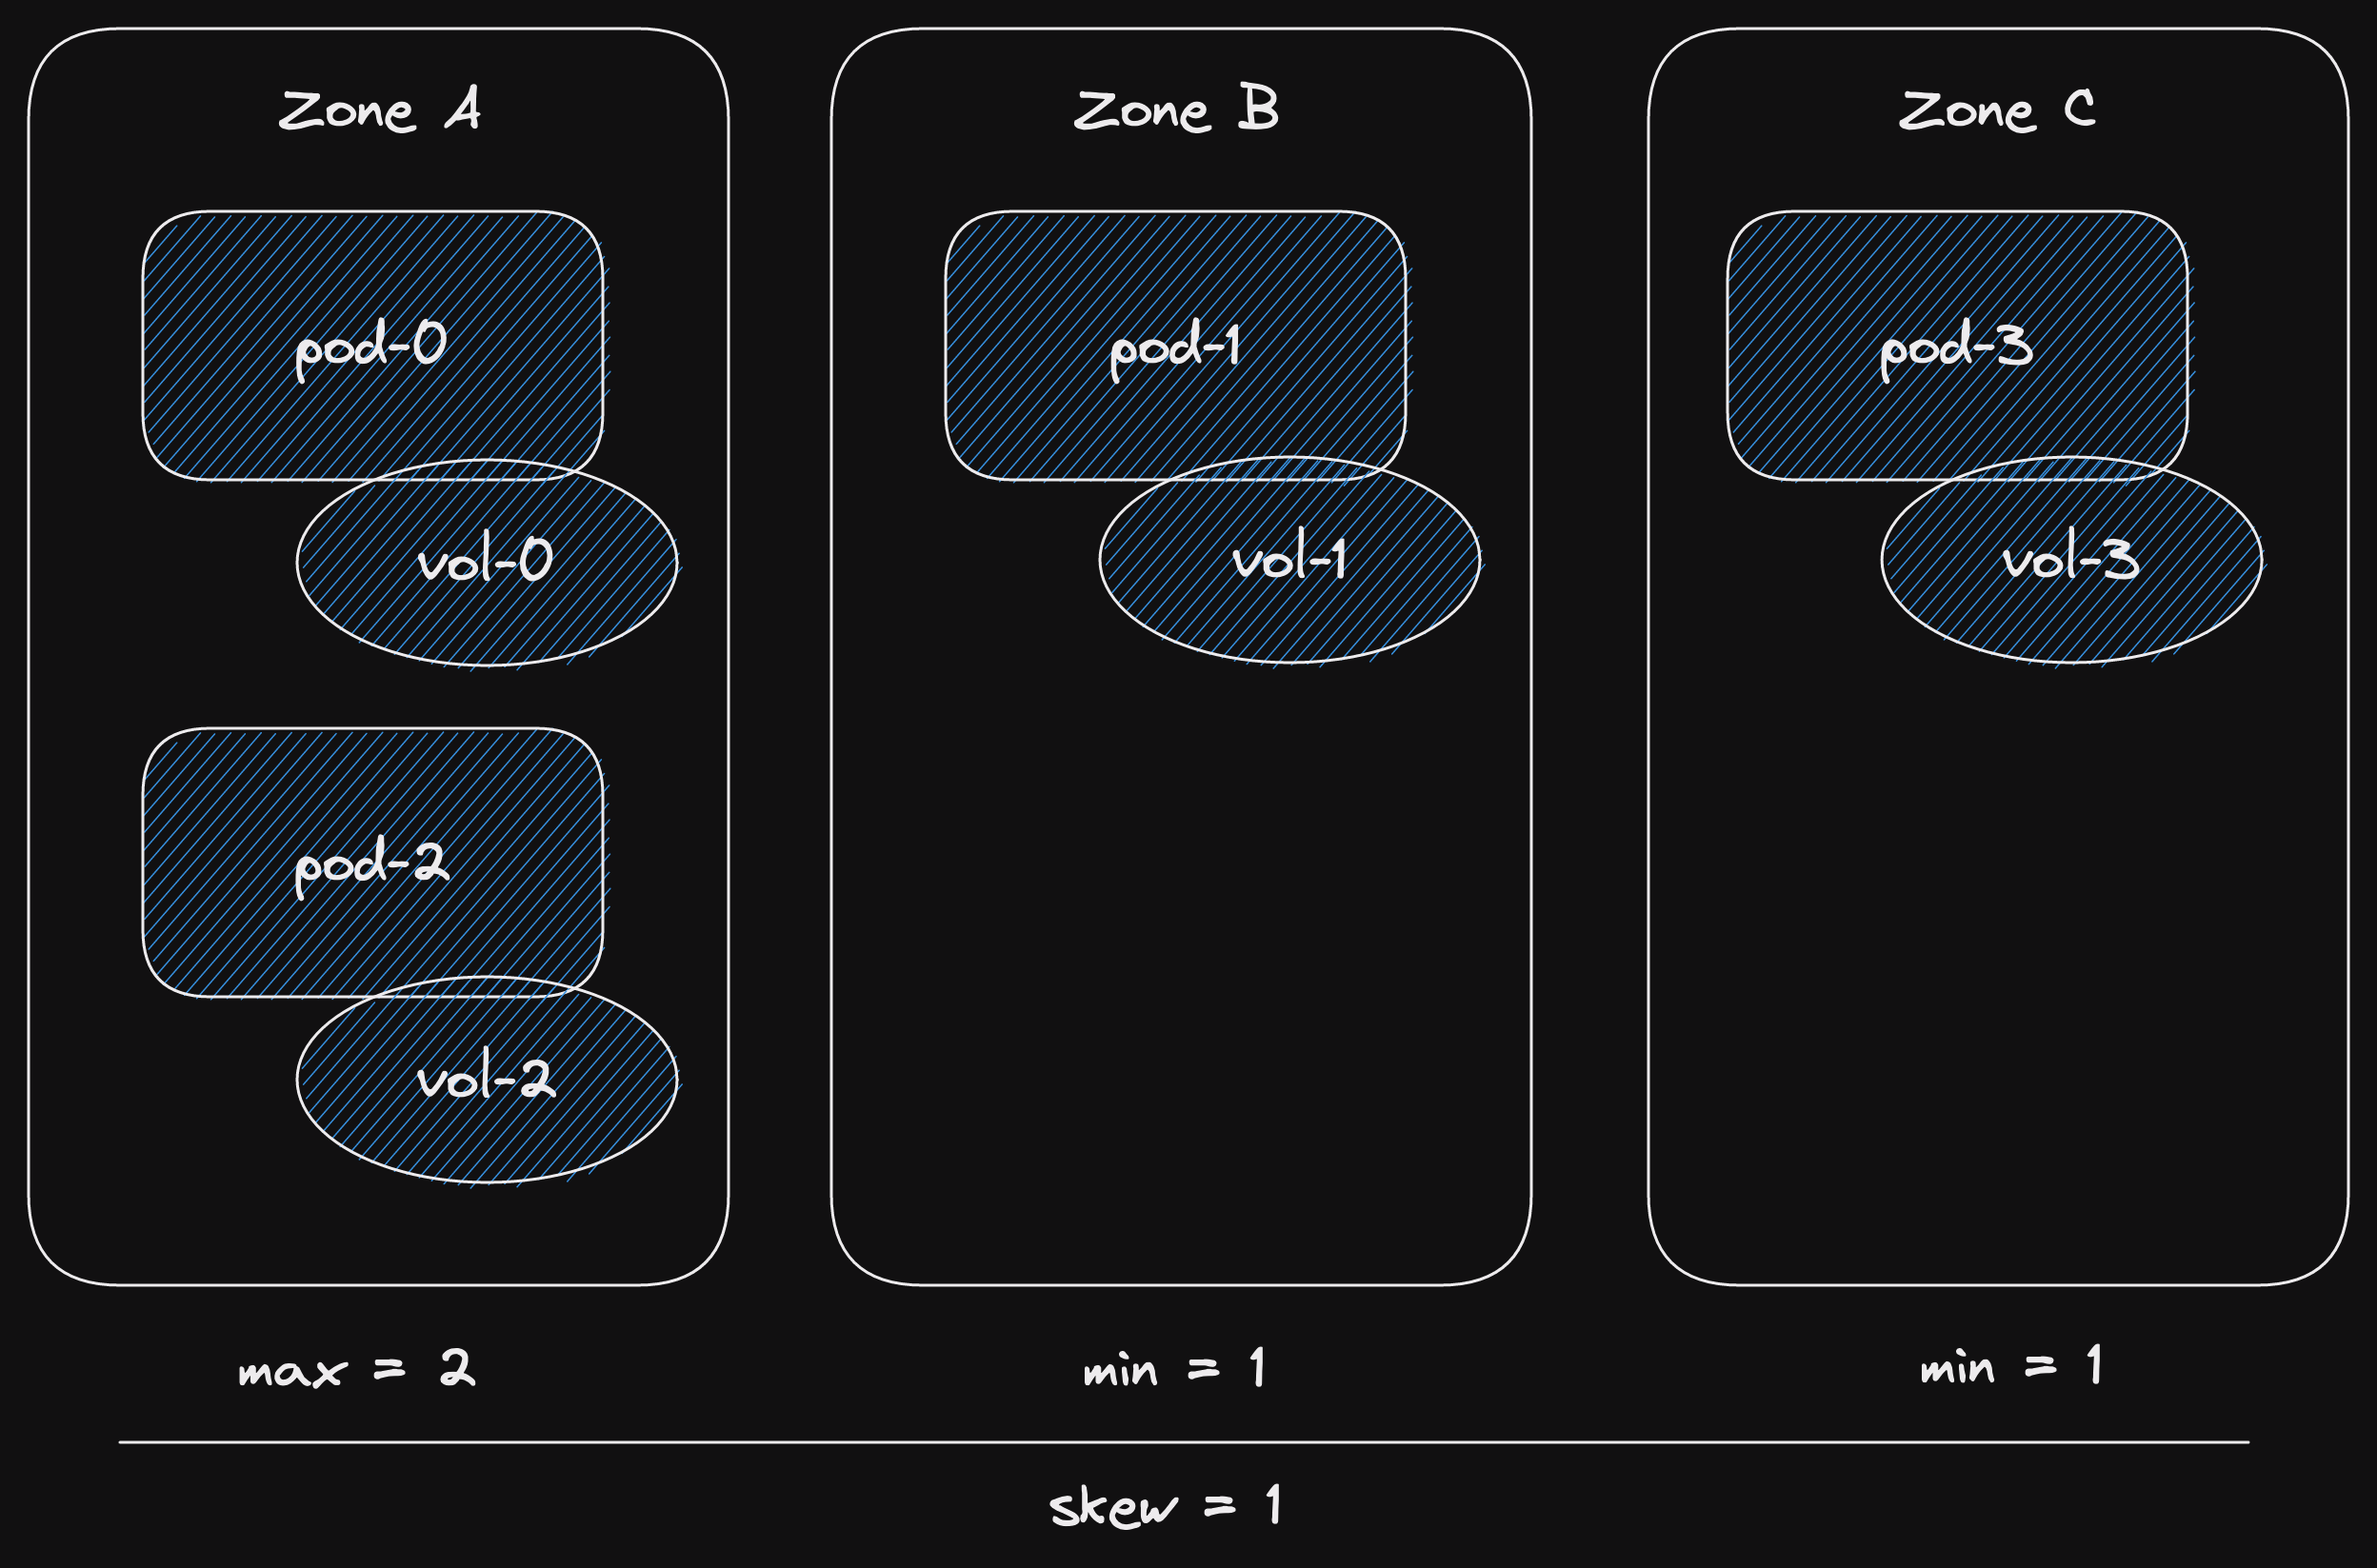
So far, so good.
We don't have so much load right now, so let's scale down to 2 pods.
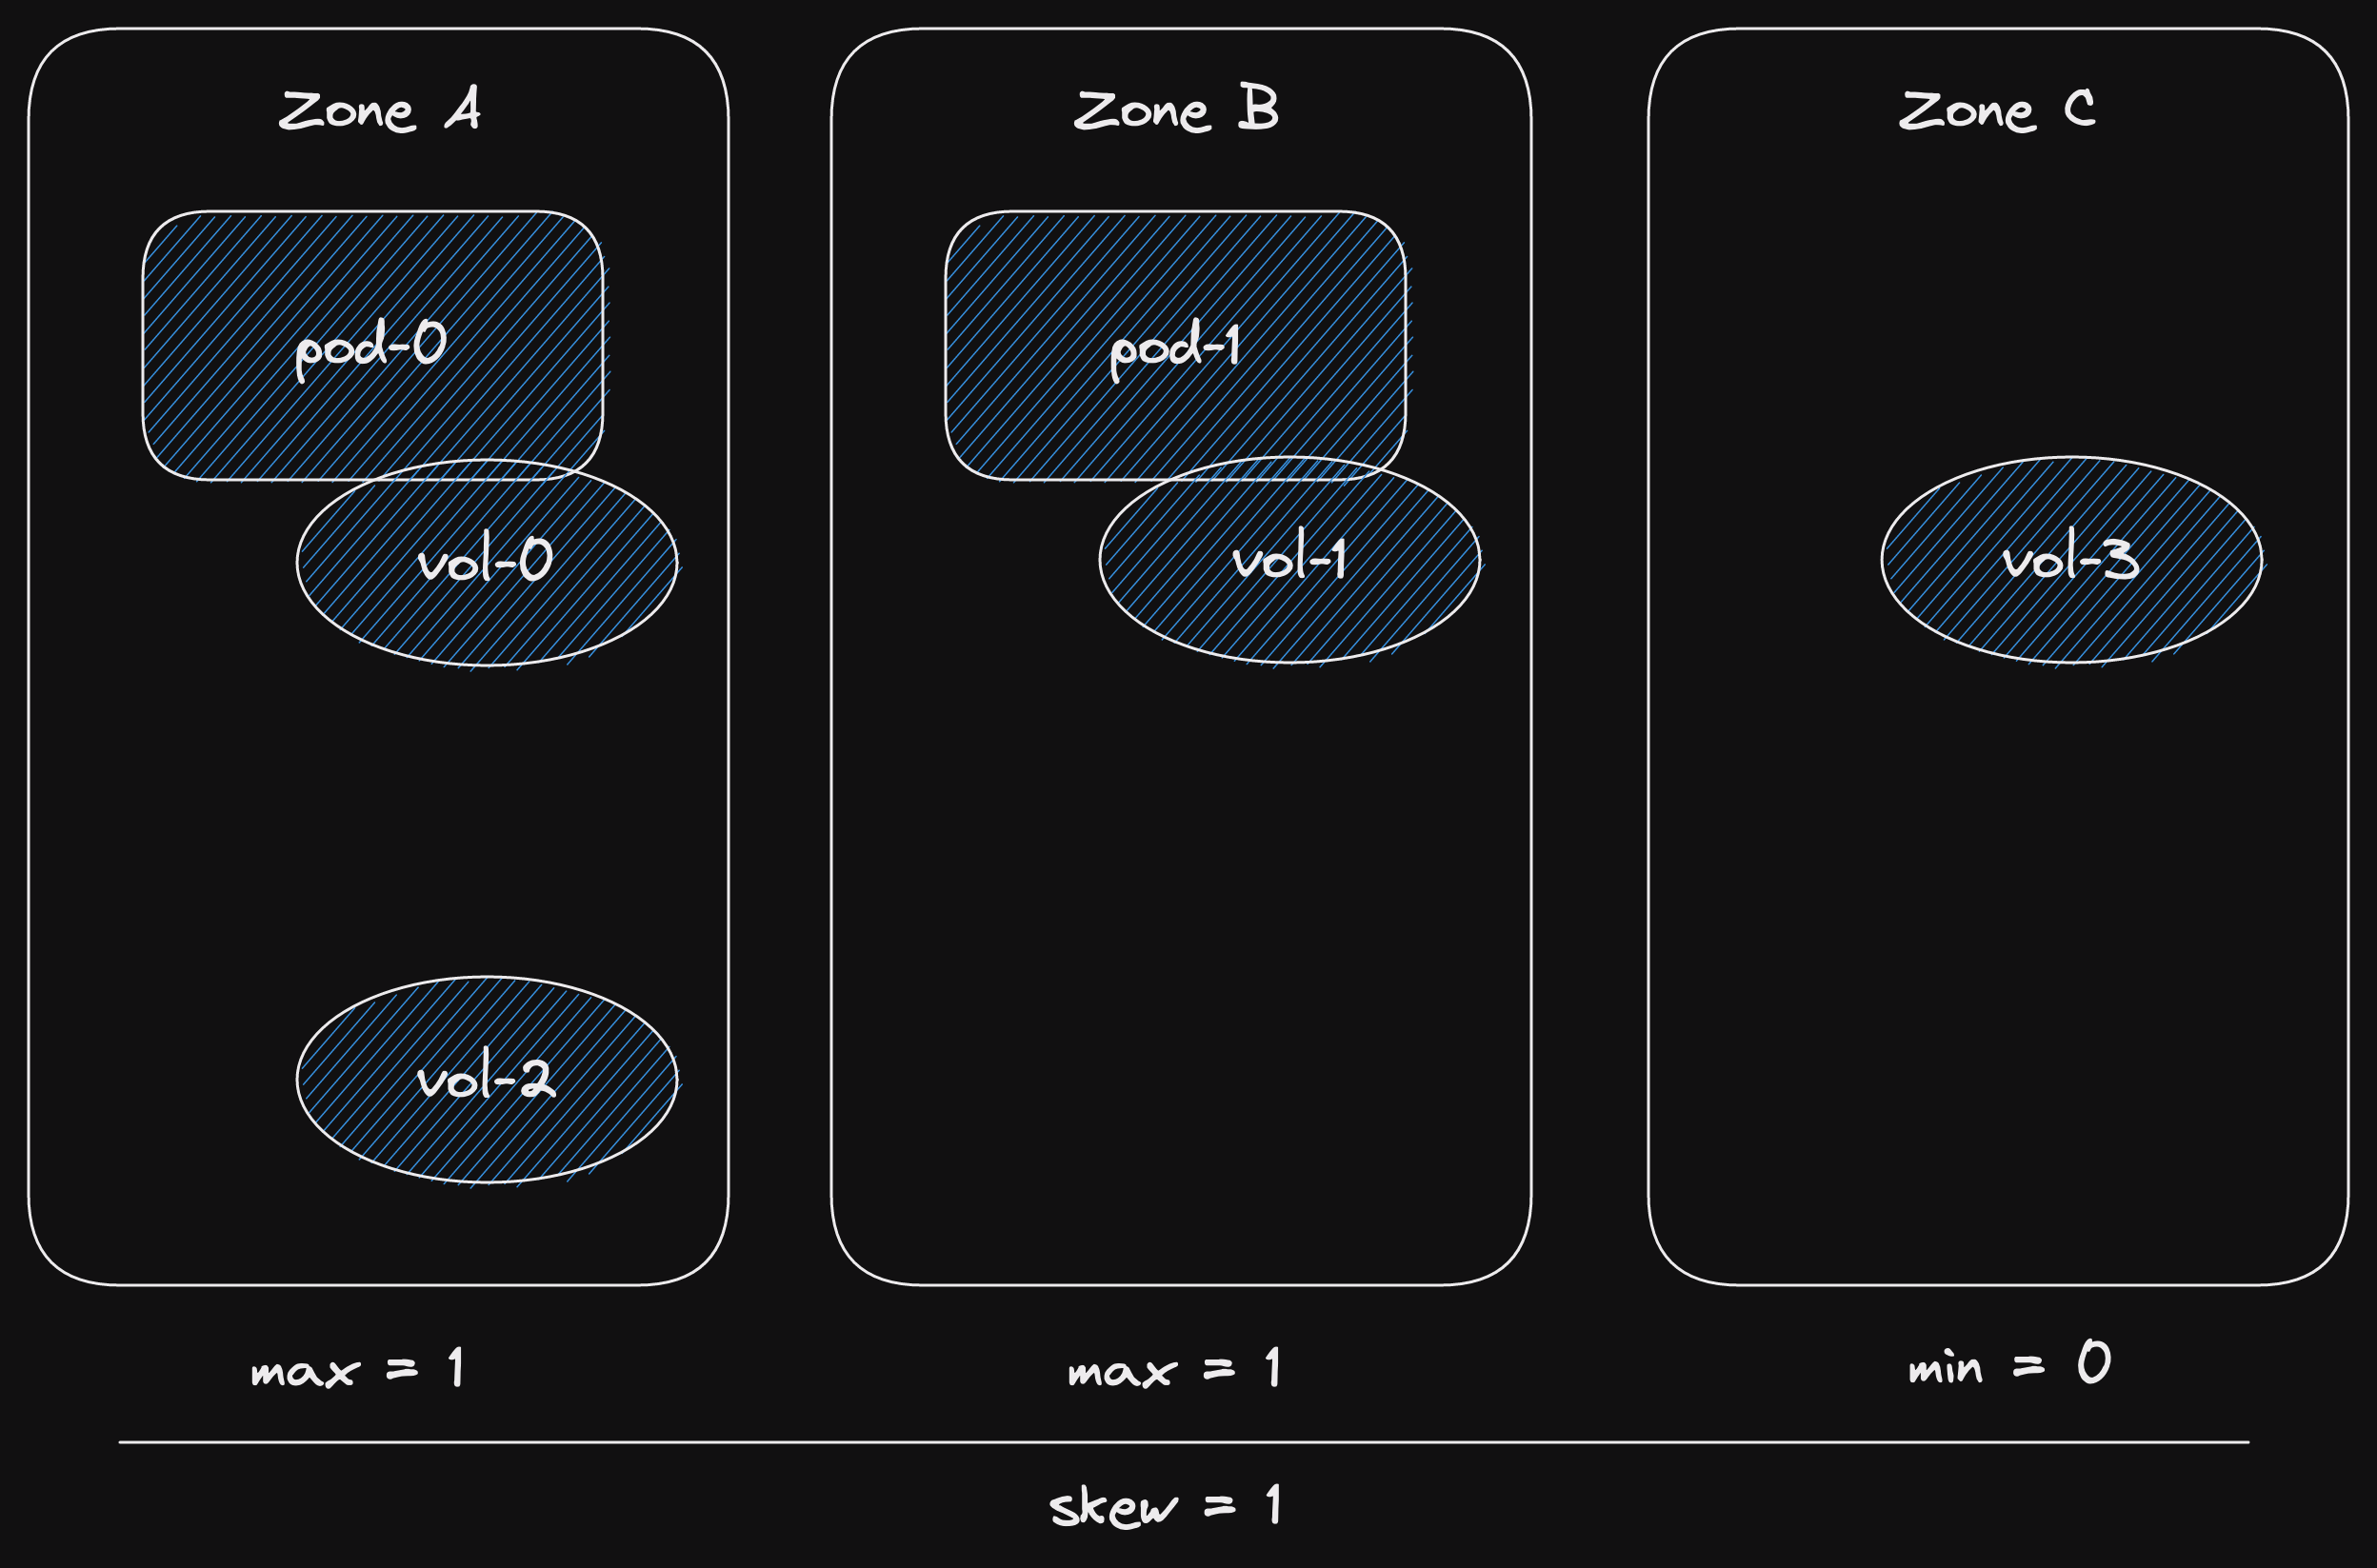
After scaling down, we don't remove the volumes.
The volumes are relatively expensive to set up.
The 8 - 10 minutes that pods take to start is mostly preparing the volume.
Downloading data, warming up the on-disk cache.
A pod with a pre-existing volume starts in 1 - 2 minutes instead.
So it's important to keep those volumes.
Now let's suppose that the load on our stateful set has increased.
We need to add another pod.
So let's scale one up.
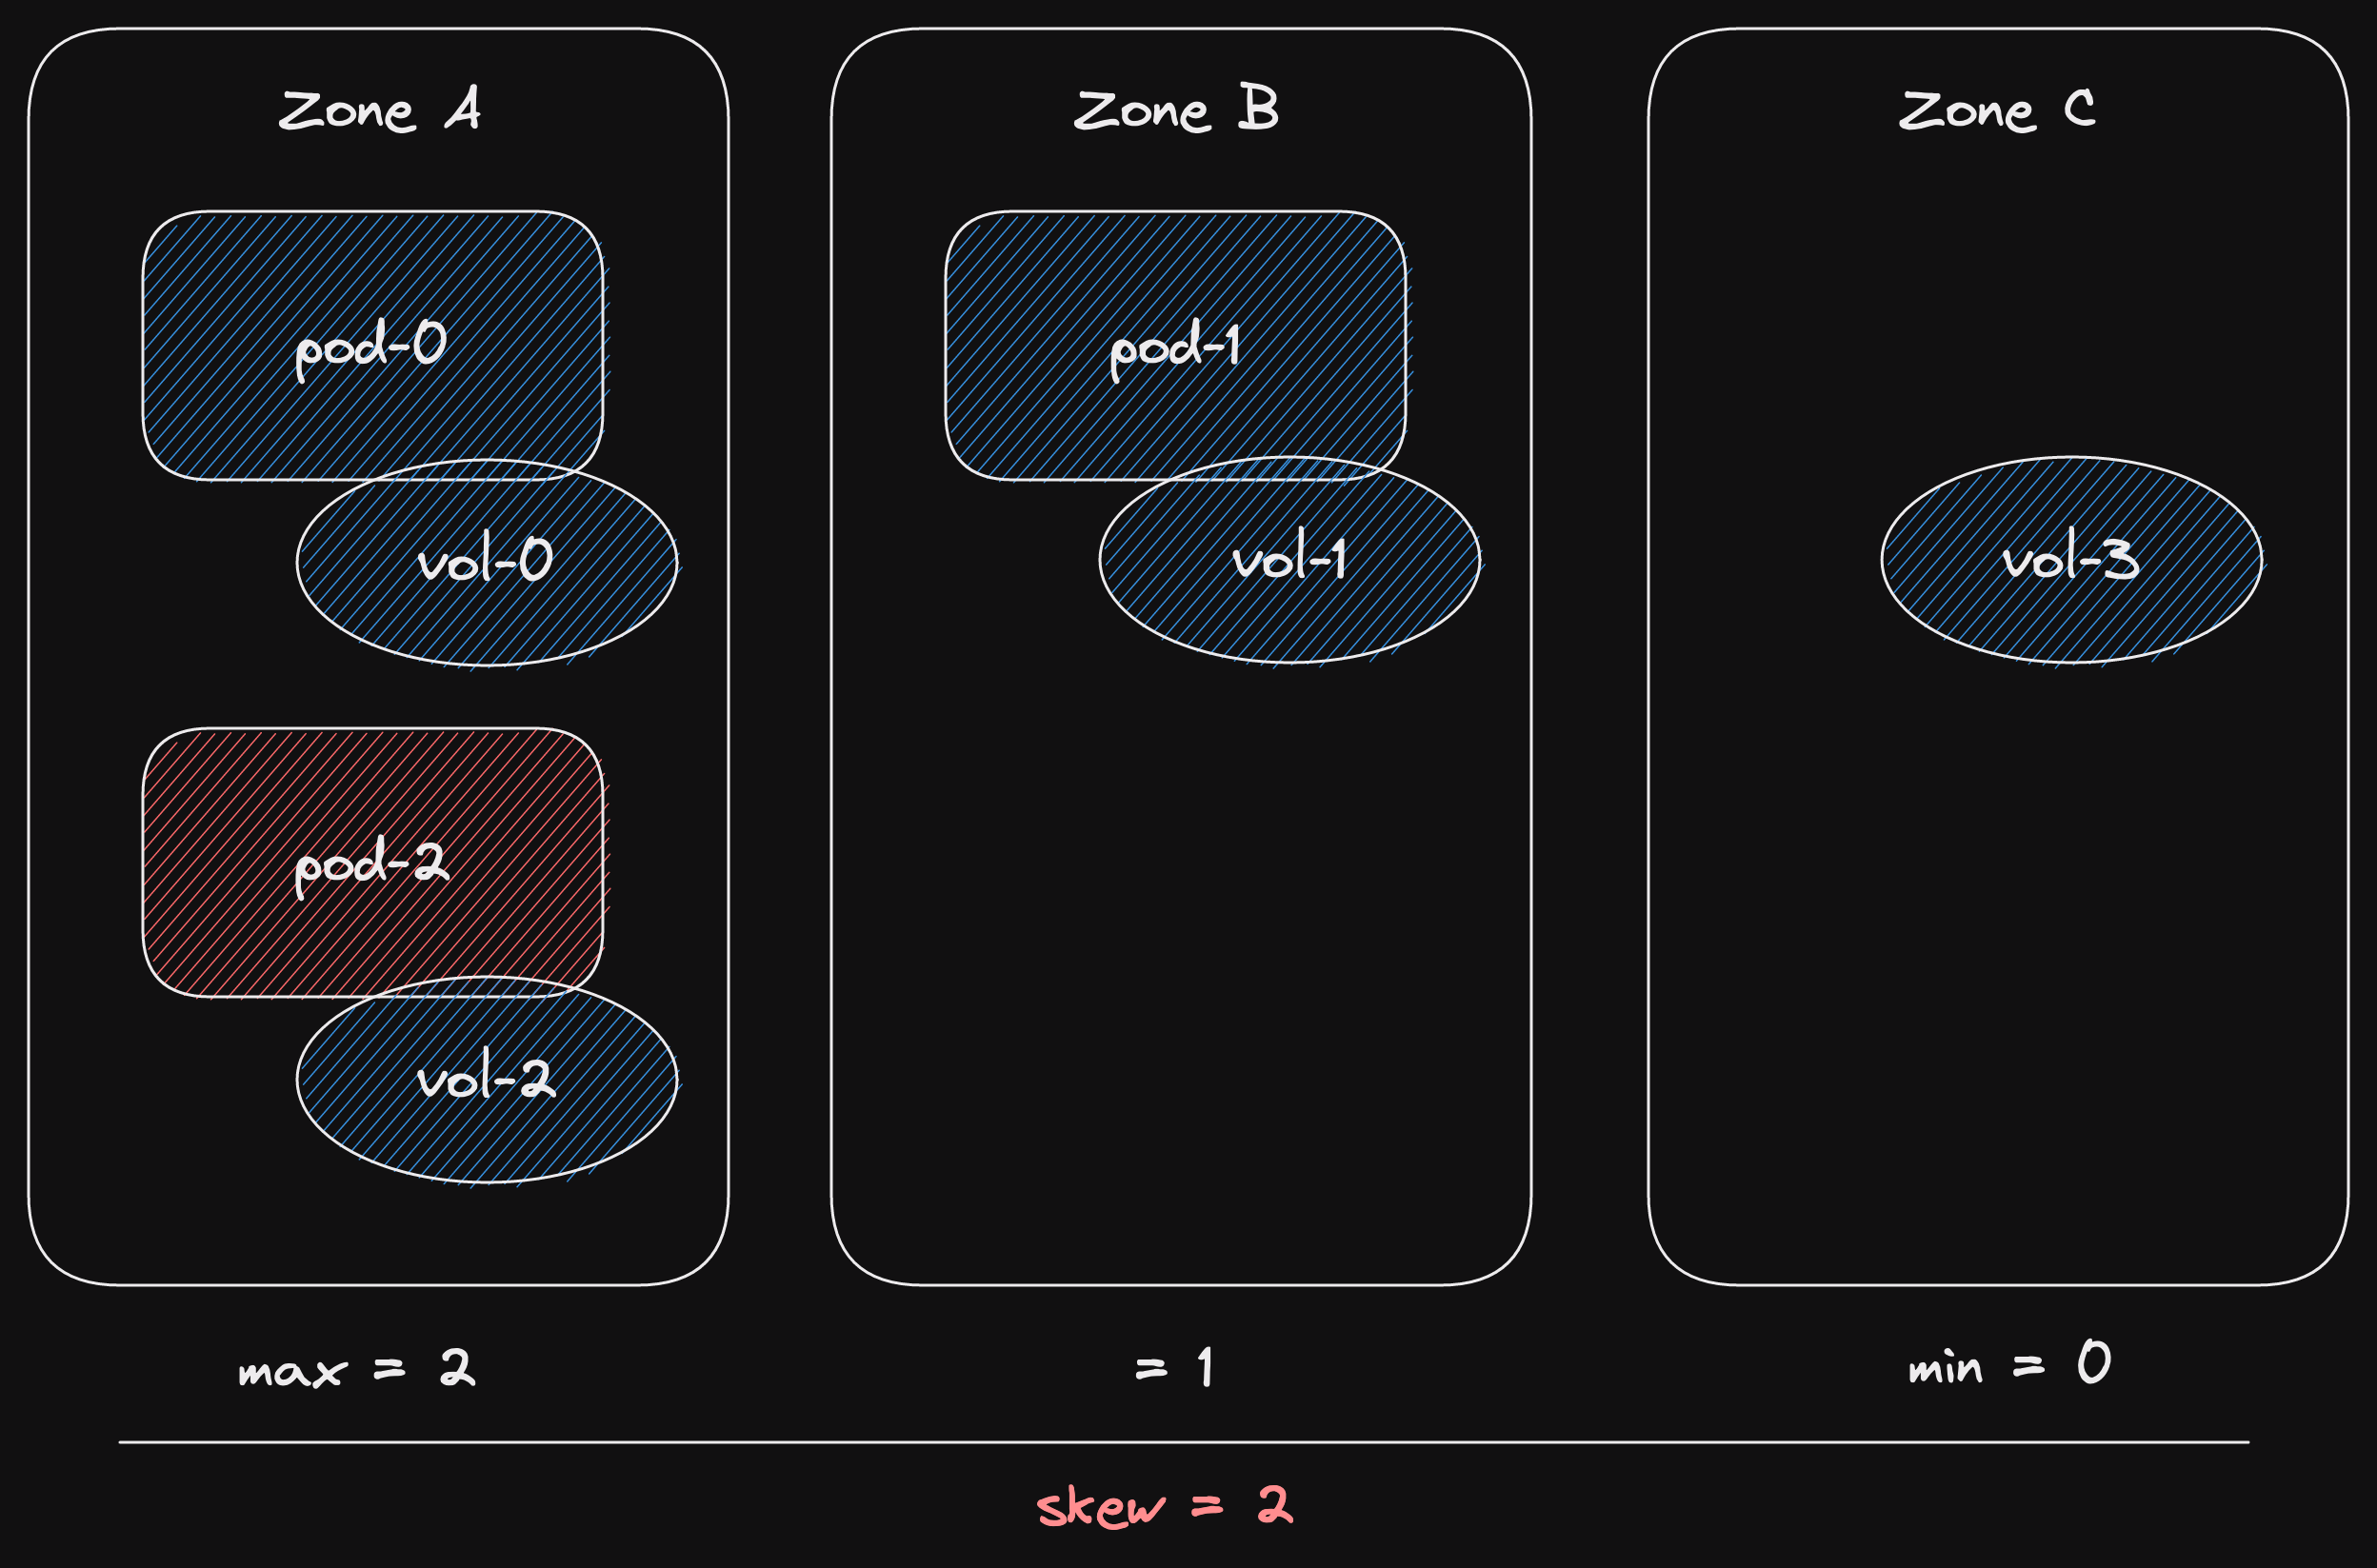
Now we hit our problem.
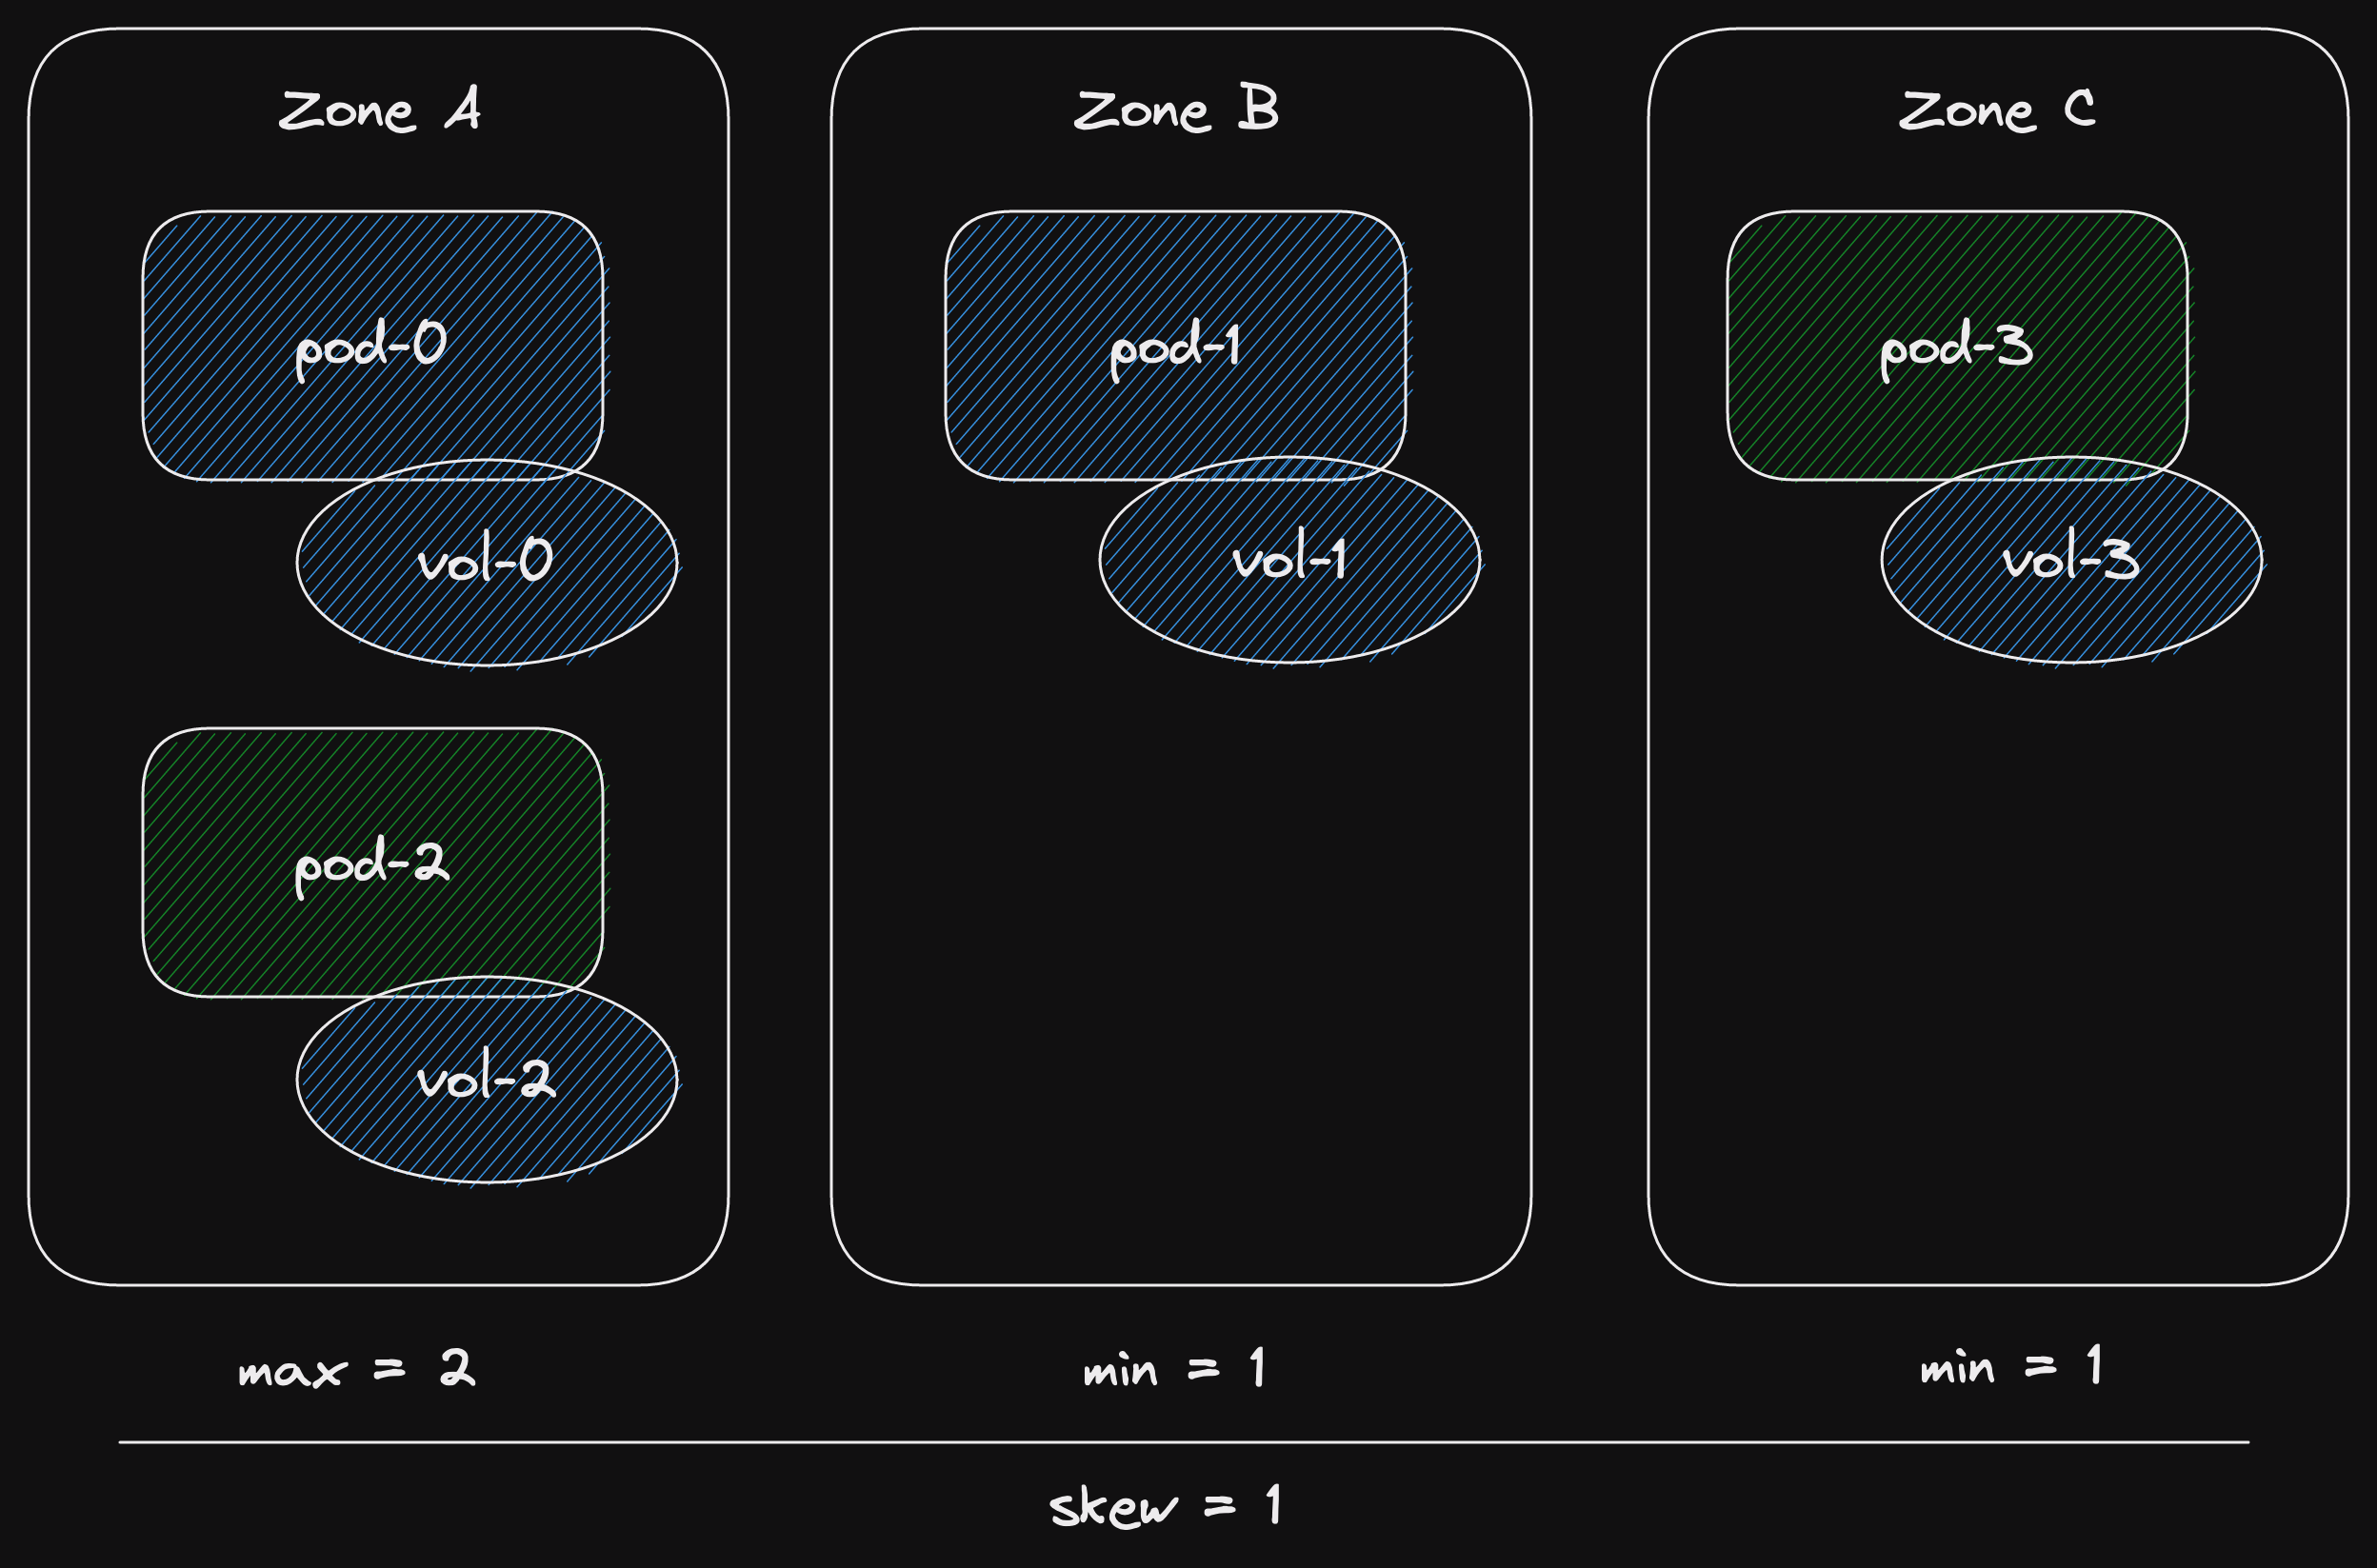
The next pod, pod-2, has a pre-existing volume in Zone A.
But if a new pod is scheduled in Zone A, we'll have 2 pods in Zone A.
And no pods in Zone C.
That's a skew of 2, greater than our maximum of 1.
So the scheduler basically waits for a miracle.
It knows that it can't schedule pod-2 because it would breach the topology spread constraints.
And it can't schedule a pod in Zones B or C because vol-2 can't be attached.
So it gives up and tries again later.
And fails.
And gives up and tries again later.
And fails.
And this would go on until the end of time.
Except just then, a miracle occurs.
The load on our stateful set increases even more.
We need another pod!
Now we can schedule pod-3 in Zone C.
And schedule pod-2 in Zone A.
(where we've been trying to schedule it for what feels like aeons.)
And our skew is 1!
And this is why we saw a single pod pending for a long time.
And then 2 pods go ready in quick succession.
the solution
Unfortunately I don't have such a happy ending as in part 1.
The solution is to use the OrderedReady pod management policy.
But that's impractical due to the long per-pod start up time.
So the solution is to loosen the constraint.
Allow the topology spread constraints to be best effort, rather than strict.
the ideal solution
Ideally, I want a new pod management policy.
I'd call it OrderedScheduled.
Each pod would be begin scheduling as soon as the previous pod was scheduled.
That way, pods are scheduled in order.
So scaling up and down won't breach the topology spread constraints.
Of course, this is just an idea.
There are probably many sides that I haven't considered.