kubernetes memory
by on Monday, 30 September 2024
I've been trying to get my head around the memory metrics reported by kubernetes and what the numbers mean. Especially since the gaps caused us problems a while back. (Thanks to Maksym and Chris for explaining!)
My issue was that I hadn't entirely understood how page caches get represented in the cAdvisor metrics which you get from kubernetes.
This is the best analysis I've found (thanks Ellie!):
That post is focussed on calculating kubernetes node memory usage. As a user (not an administrator) of kubernetes, this isn't so interesting to me. But it did set me on the right path.
That post has a great diagram which attempts to cAdvisor metrics with node-exporter metrics. I have the cAdvisor metrics as I mentioned above, but the node-exporter metrics aren't interesting to me (and I don't have them anyway).
It does give a good description of the active and inactive page caches and the difference. From here, I decided that I was most interested in understanding the following 3 parts of my application's memory usage:
- RSS - Linux's
rssvalue (Resident Set Size). This is the memory allocated by the application, not backed by a file. - Active page cache - File cache which has been accessed at least twice.
- Inactive page cache - File cache which has only been accessed a single time.
Apparently, the only difference between the active and inactive page cache is that the active ones have been accessed more than once.
I tried to match up the metrics that I can get from cAdvisor with the Linux memory concepts I'm trying to track.
This post had a good description of how these values fit together:
This second post gives some details on what RSS means including links to the kernel documentation, which was handy.
I know that I want the RSS and two page cache values, but these are the metrics that you can actually get from cAdvisor:
container_memory_rss- resident set size (rss)container_memory_working_set_bytes- working set size (wss)container_memory_usage_bytes- usagecontainer_memory_cache- memory cache
With a little more work, I was able to piece together how these things fit into one another. Here's a visual representation:
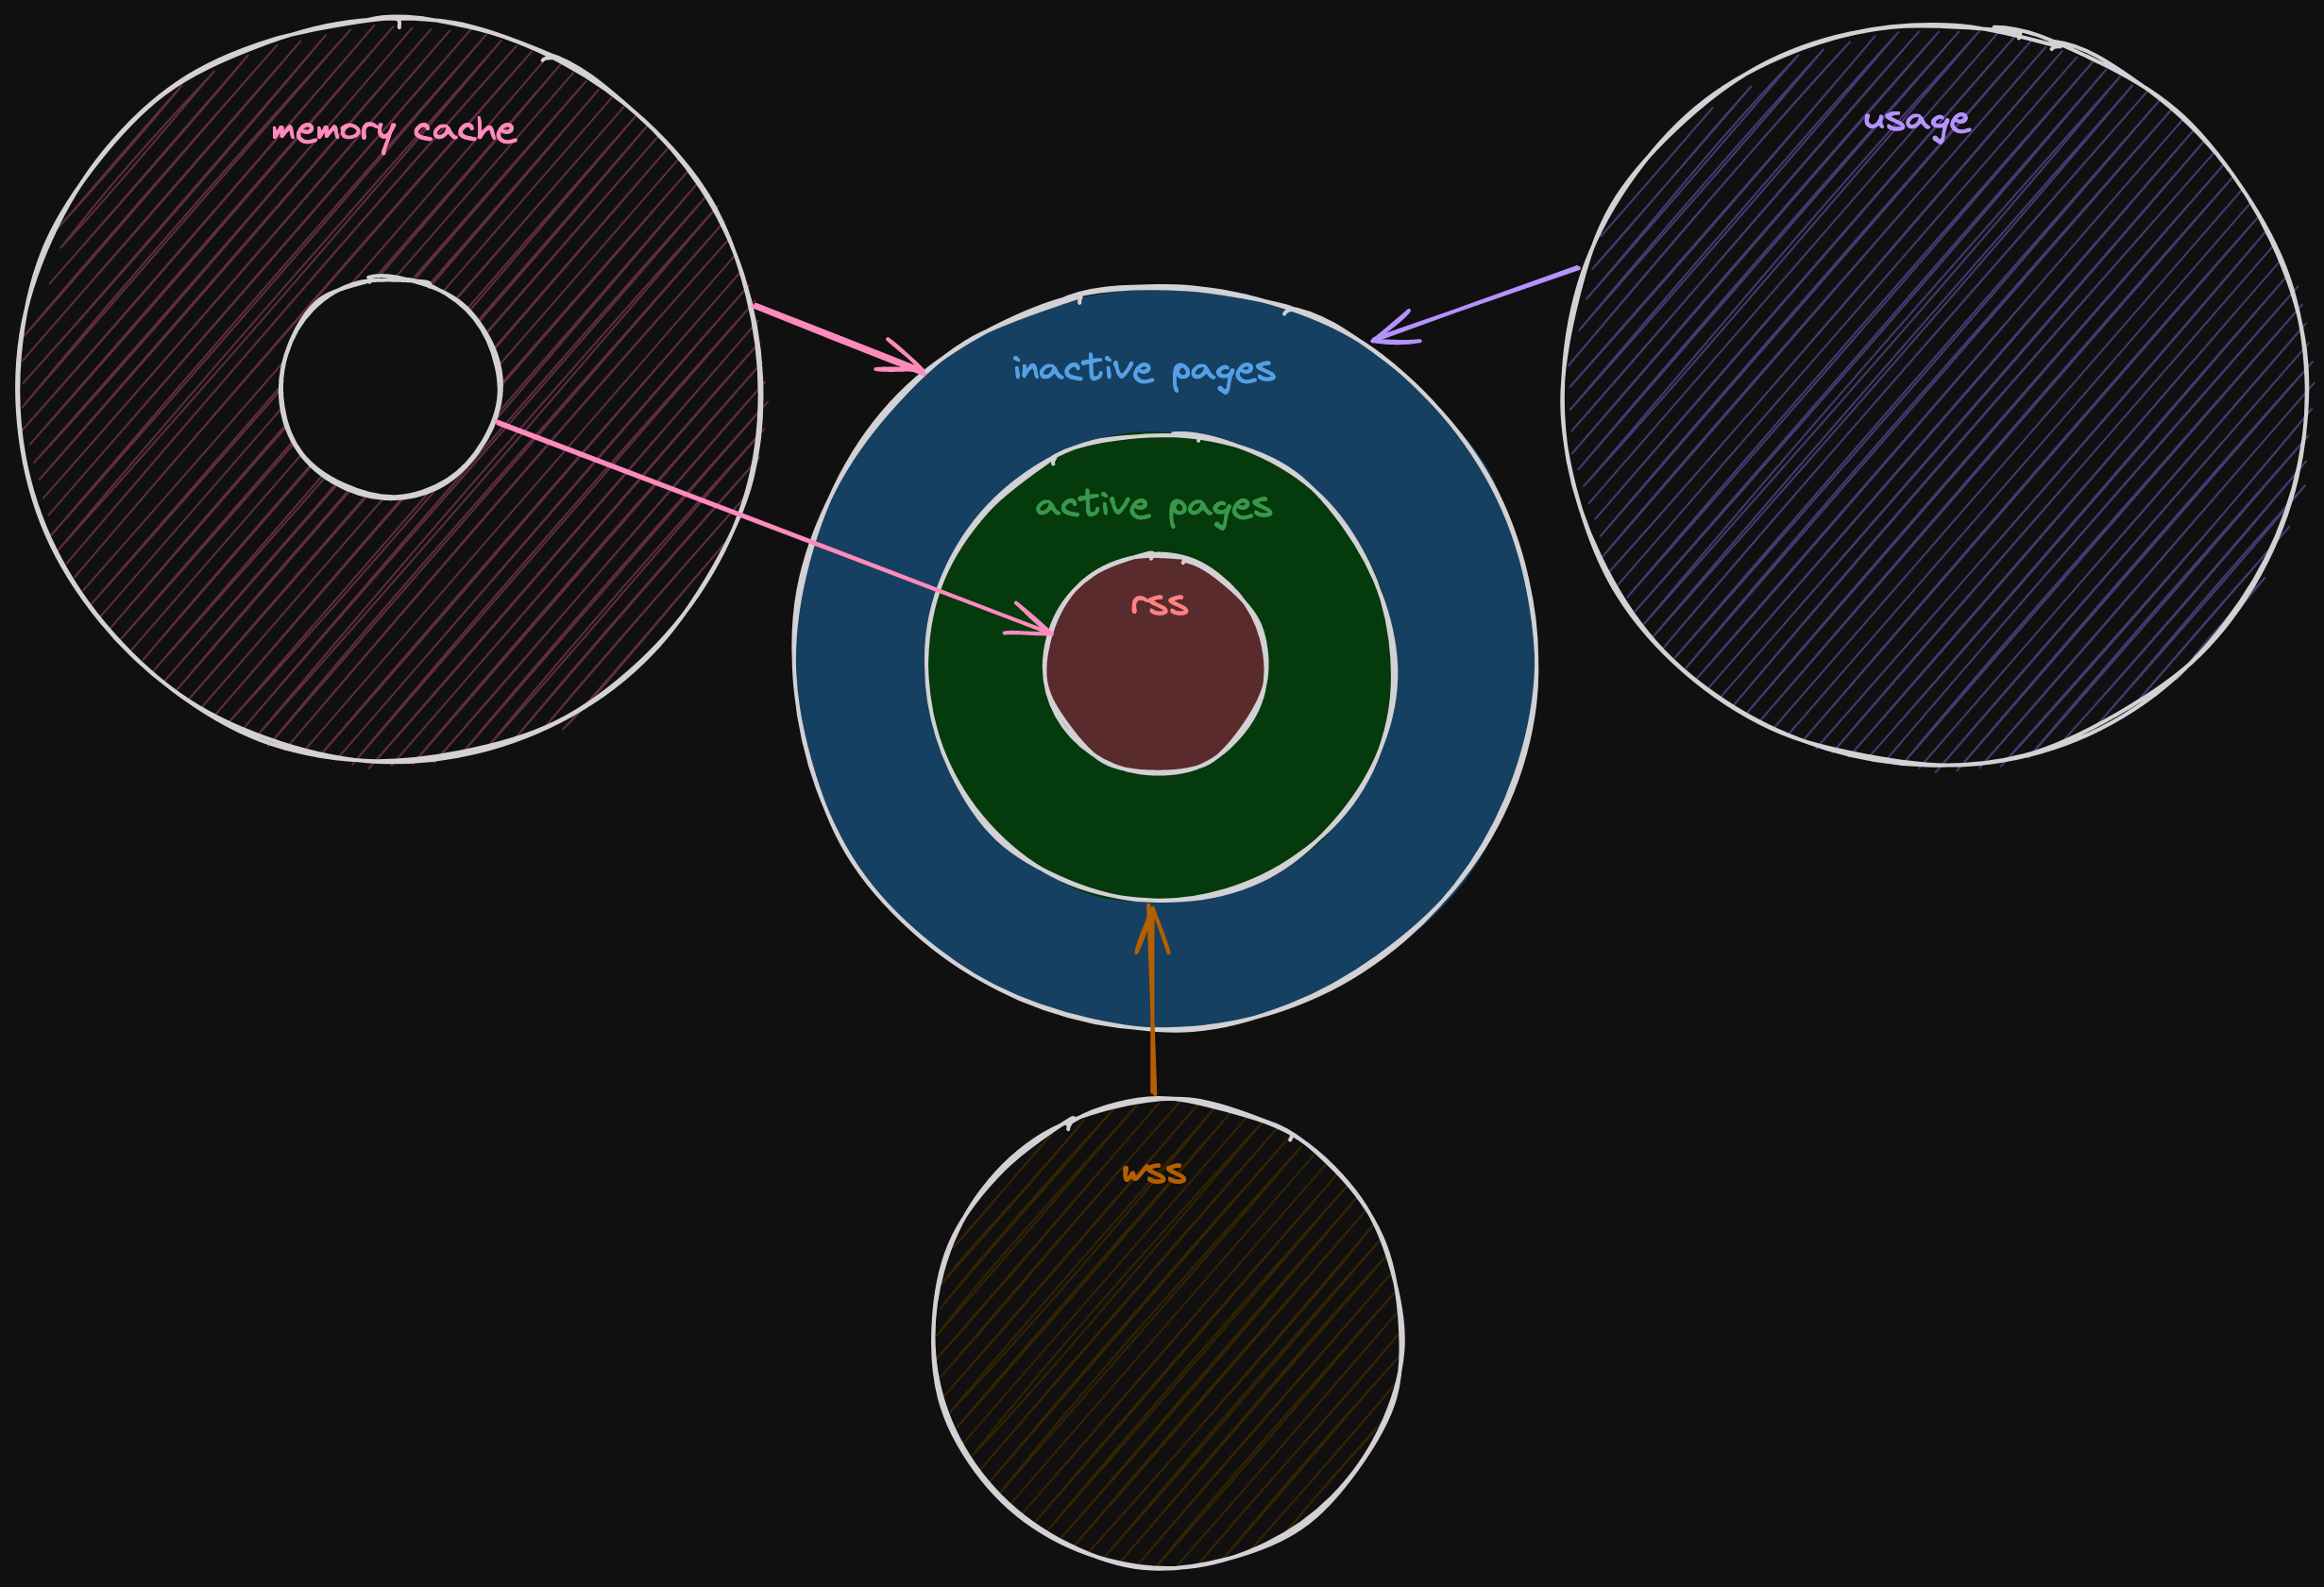
In the middle are the 3 values I want, and then surrounding them are the 3 metrics that I metrics that I have access to. The 4th metric is RSS itself, so that one is easy.
But now I can work out how to get the values I'm interested in:
- RSS ->
container_memory_rss - Active page cache ->
container_memory_working_set_bytes-container_memory_rss - Inactive page cache ->
container_memory_usage_bytes-container_memory_working_set_bytes
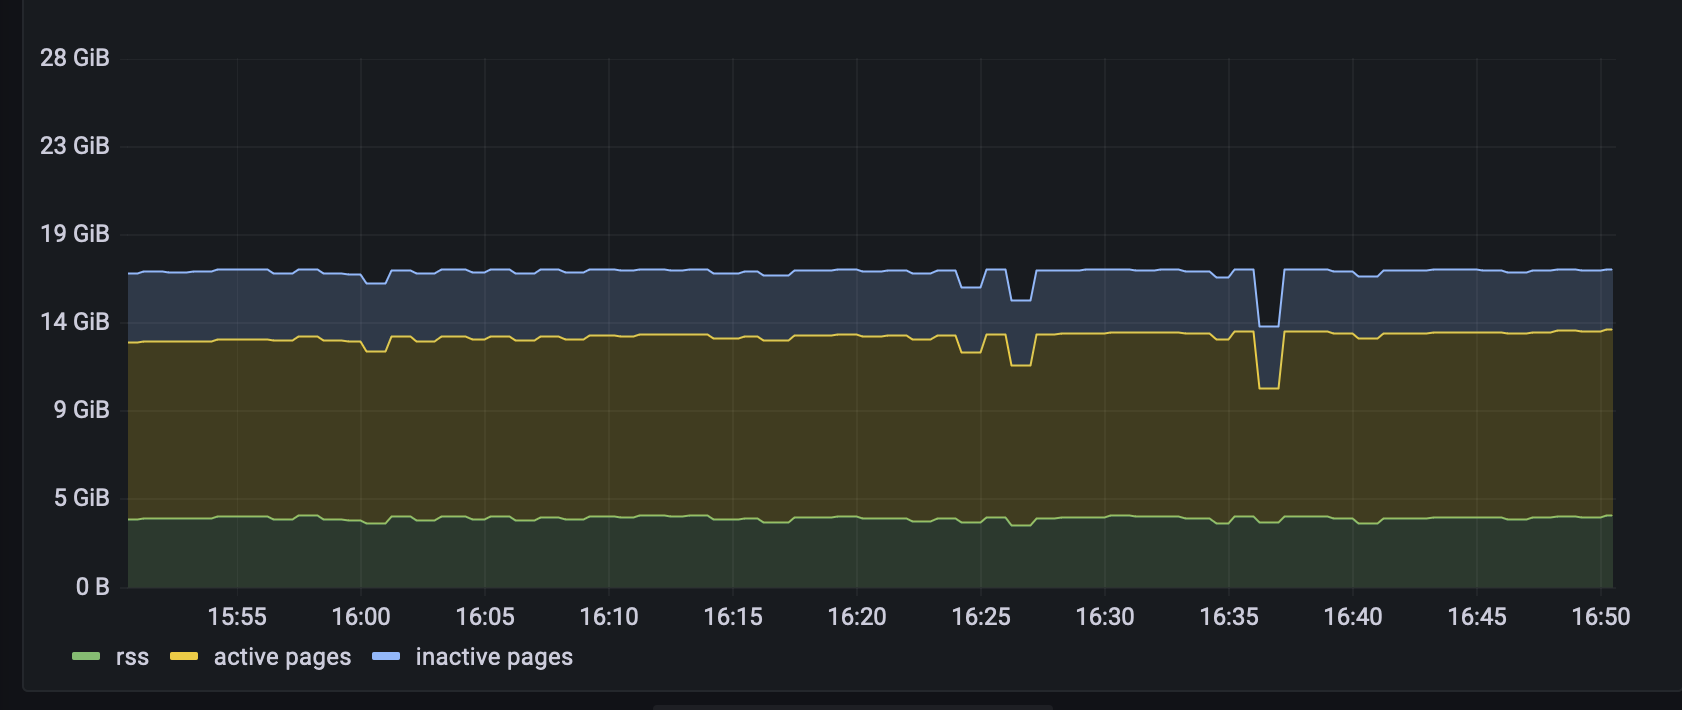
This allows me to create a stacked time series showing these three values. This isn't possible with just the metrics that cAdvisor provides because they overlap.
And that's all I ever really wanted. Well, except one thing...
can you help?
One thing I wanted to do as part of this post was write a small utility which would allow me to scale up different memory values independently. This would be a nice tool to interactively test assumptions about what kubernetes does when the RSS or certain page caches get larger.
Unfortunately, I wasn't able to get anything assigned to the active page cache, which is to say that the container_memory_usage_bytes metric increased, but container_memory_working_set_bytes didn't.
If you know a sure fire way to make Linux assign parts of a file to the active page cache, or why it might not happen with repeated access, that would be great. If your solution is in Rust, even better!